National View
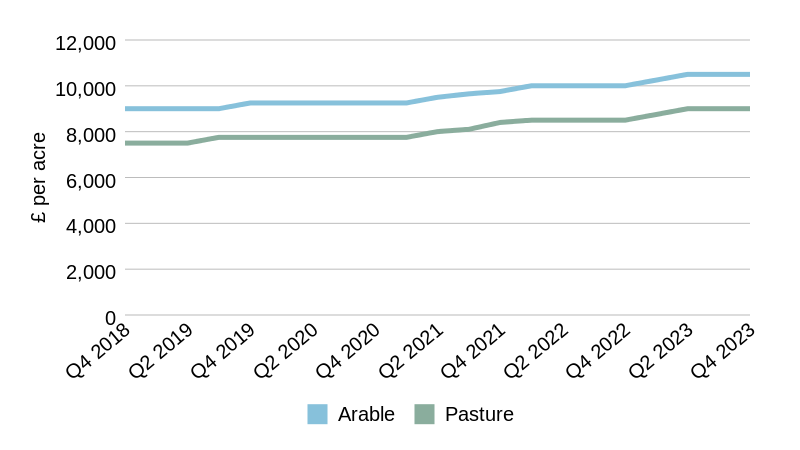
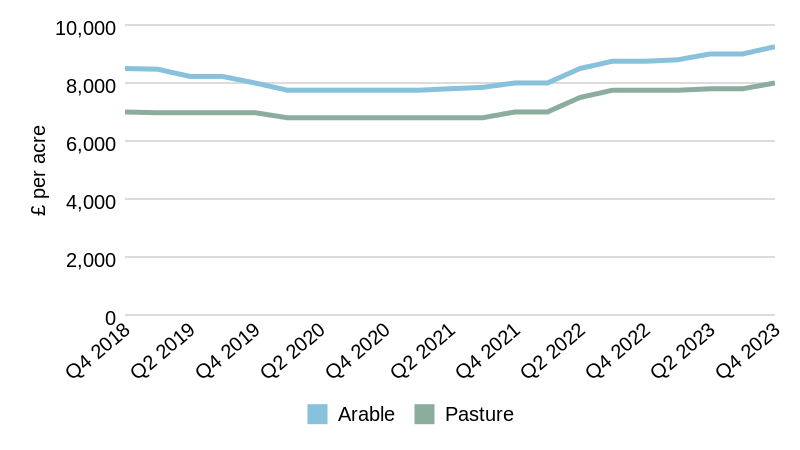
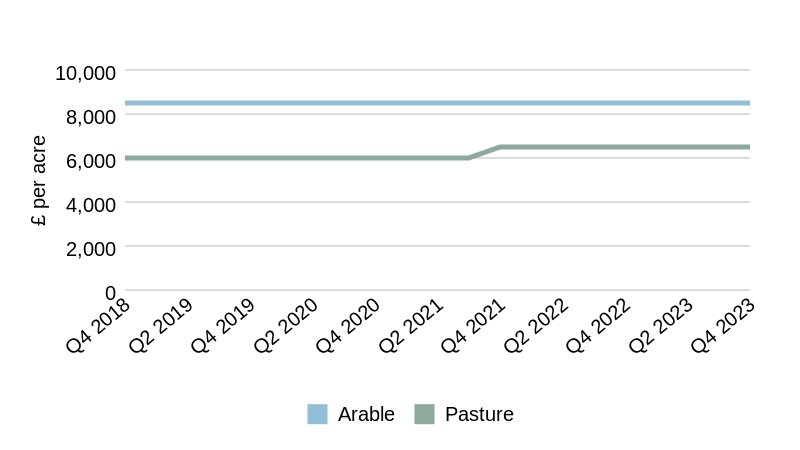
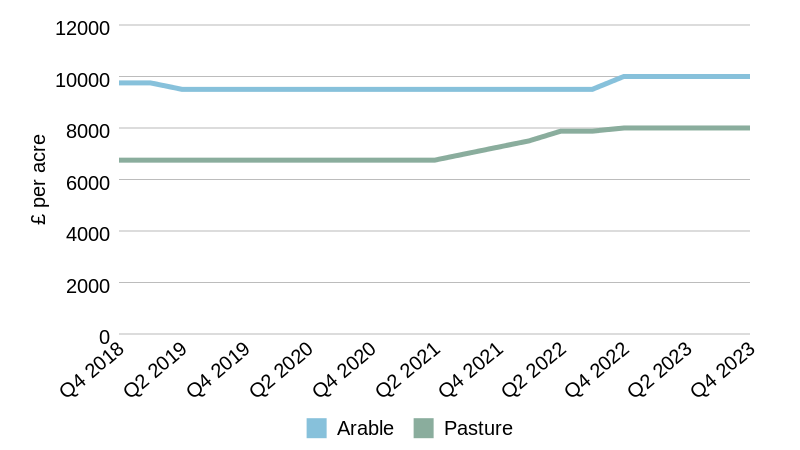
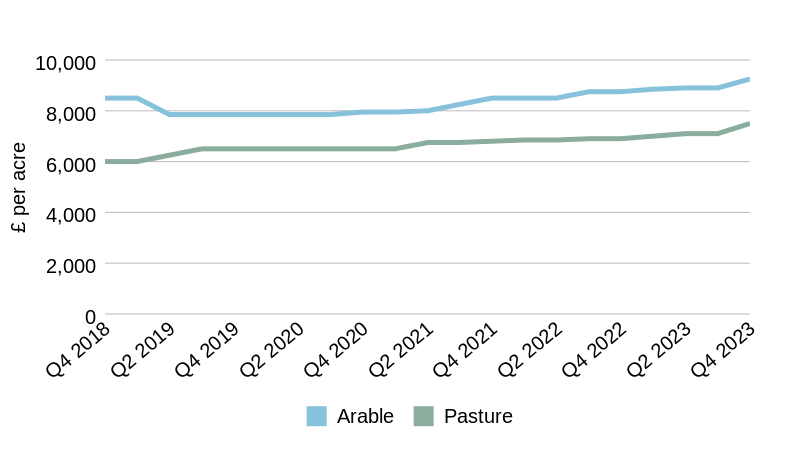
Average farmland values across England and Wales closed out the year on a high note, increasing moderately from Q3 to Q4 2023 after a brief plateau in the previous quarter. Arable land values reached £9,583/acre, an increase of 0.7% from Q3 2023. Pasture land values increased at a slightly faster rate, rising by 0.9% to an average of £7,750/acre.
While year-on-year growth has eased from the levels seen between Q4 2021 and Q2 2023, it remains on an upward trajectory. When compared to Q4 2022, average arable land values have increased by 3.8% and average pasture land values by a similar 3.7%. Pasture land values have reached another record high, while arable land values remain just 5.7% behind their previous peak in Q2 2016.
Longer-term trends are also robust, indicating the market’s strong fundamentals and resilience. In the ten years to Q4 2023, average arable and pasture land values have seen healthy annualised growth rates of 2.6% and 3.2% respectively. Cumulatively, arable land values have grown by 29.1% over this period, while pasture land has increased by 36.9%.
It is encouraging that, despite the economy being in a state of flux, land value growth has not entered negative territory in over three years. This is particularly impressive when considering the more turbulent performance of capital values in the commercial and housing markets. Annual change in commercial capital values during 2023 varied from a low of -21.2% in June to -5.6% in December (MSCI All Property Monthly Index). In the housing market, annual change has varied from +4.9% in January 2023 to -2.1% in November 2023 (HM Land Registry). Of course, diversified estates owners with commercial or residential assets may be exposed to these fluctuations in the overall capital value of their portfolio.
The outlook for the farmland market is positive. Key upward pressures of historically low supply, ‘waiting cash’ and an increasing array of purchasers continue to drive up land values, while negative influences on market sentiment look set to ease. The impact of sustained inflation on profit margins has been a particular concern. Although there was a minor increase in inflation from 3.9% to 4.0% on the CPI measure in December, this follows two sharp falls and is below the 4.4% estimated in the HM Treasury Consensus Forecasts (November). While this is still stubbornly above Bank of England’s target of 2%, the broader trend should still be downwards.
£9,583
per acre
Average
arable land
value in Q4
Q-ON-Q
CHANGE
+0.7%
+3.8%


y-ON-y
CHANGE
£7,750
per acre
Average
pasture land
value in Q4
Q-ON-Q
CHANGE
+0.9%
+3.7%
y-ON-y
CHANGE


Farmland
Market Update
Q4 2023
Key data and expert commentary outlining
trends in the farmland market

“Land value growth has not entered negative
territory in over three years.”
FIGURE 5
A rebalancing of commodity prices
Source: Carter Jonas, AHDB, Farmers Weekly, Defra, ONS, OPEC
Input
Outputs


Crude Oil
Fertiliser
Red Diesel
Feed Wheat
Oilseed
Rape
Milk
Beef
Pork

CRUDE OIL
Unit
Latest data
Date
Quarterly change
Annual change
£/barrel
62.4
Dec '23
-18.1%
-4.6%

Fertiliser
Unit
Latest data
Date
Quarterly change
Annual change
£/tonne
353.9
Dec '23
-2.3%
-49.5%

Red Diesel
Unit
Latest data
Date
Quarterly change
Annual change
pence/litres
83.8
Dec '23
-6.0%
-21.5%

Feed Wheat
Unit
Latest data
Date
Quarterly change
Annual change
£/tonne
195.3
Dec '23
1.9%
-27.8%

oilseed rape
Unit
Latest data
Date
Quarterly change
Annual change
£/tonne
376
Dec '23
0.0%
-28.8%

MILK
Unit
Latest data
Date
Quarterly change
Annual change
pence/litre
37.0
Oct '23
2.5%
-26.9%

BEEF
Unit
Latest data
Date
Quarterly change
Annual change
pence/kg dw
486.3
Dec '23
2.2%
9.4%

Pork
Unit
Latest data
Date
Quarterly change
Annual change
pence/kg dw
210.6
Dec '23
-3.9%
4.6%


Click a location for
a local overview


East of England
Arable
Pasture
£7,250
£6,500
£11,250
£9,250
£9.250
£7,500
3.9%
5.6%
5.1%
8.7%
Low
£ / acre
Prime
£ / acre
Average
£ / acre
Quarterly %
Annual %
East of England land values
North West
Arable
Low
£ / acre
Prime
£ / acre
£ / acre
Quarterly %
Annual %
Average
£8,000
£6,500
£12,000
£10,000
£10,000
£8,000
0.0%
0.0%
0.0%
0.0%
Pasture
EMAIL SAM
07768 658217
Associate Partner
Sam Johnson

North West land values
Wales
Arable
Low
£ / acre
Prime
£ / acre
£ / acre
Quarterly %
Annual %
Average
£8,250
£4,250
£10,000
£8,500
£8,500
£6,500
0.0%
0.0%
0.0%
0.0%
Pasture
EMAIL Hugh
01248 360417
Partner
Hugh O’Donnell

Wales land values

North East
Arable
Low
£ / acre
Prime
£ / acre
£ / acre
Quarterly %
Annual %
Average
£6,500
£4,250
£8,750
£6,500
£7,500
£5,750
0.0%
0.0%
4.2%
0.0%
Pasture
EMAIL Sam
01423 707801
Associate Partner
Sam Johnson

North East land values

Yorkshire and the Humber
Arable
Low
£ / acre
Prime
£ / acre
£ / acre
Quarterly %
Annual %
Average
£8,000
£5,500
£11,000
£7,250
£9,000
£7,000
0.0%
0.0%
1.7%
2.2%
Pasture
EMAIL Sam
01423 707801
Associate Partner
Sam Johnson


Yorkshire and the
Humber land values
East Midlands
Arable
Low
£ / acre
Prime
£ / acre
£ / acre
Quarterly %
Annual %
Average
£8,250
£6,750
£11,000
£9,000
£9,250
£8,000
2.8%
2.6%
5.7%
3.2%
Pasture
East Midlands land values
West Midlands
Arable
Low
£ / acre
Prime
£ / acre
£ / acre
Quarterly %
Annual %
Average
£9,250
£7,000
£13,000
£11,000
£11,000
0.0%
0.0%
0.0%
0.0%
Pasture
EMAIL ANGHARAD
01213 899685
Senior Surveyor
Angharad Llewellyn

West Midlands land values
South East
Arable
Low
£ / acre
Prime
£ / acre
£ / acre
Quarterly %
Annual %
Average
£9,250
£8,000
£12,250
£9,500
£10,750
£9,000
0.0%
0.0%
7.5%
5.9%
Pasture
EMAIL Andrew
07880 084633
Partner
Andrew Chandler


Wales

West Midlands

East Midlands

South west

South east

East of england

Yorkshire & the humber

North east

North west
Get in touch
Click a trend for more info
EMAIL Jamie
01223 346592
Senior Surveyor
Jamie Elbourn


South West
Arable
Low
£ / acre
Prime
£ / acre
£ / acre
Quarterly %
Annual %
Average
£10,000
£7,000
£12,000
£11,000
£11,000
£9,000
0.0%
0.0%
10.0%
12.5%
Pasture
EMAIL David

01823 428591
Partner
David Hebditch

South West land values
EMAIL Andrew
07880 084633
Head of Rural Agency
Andrew Chandler


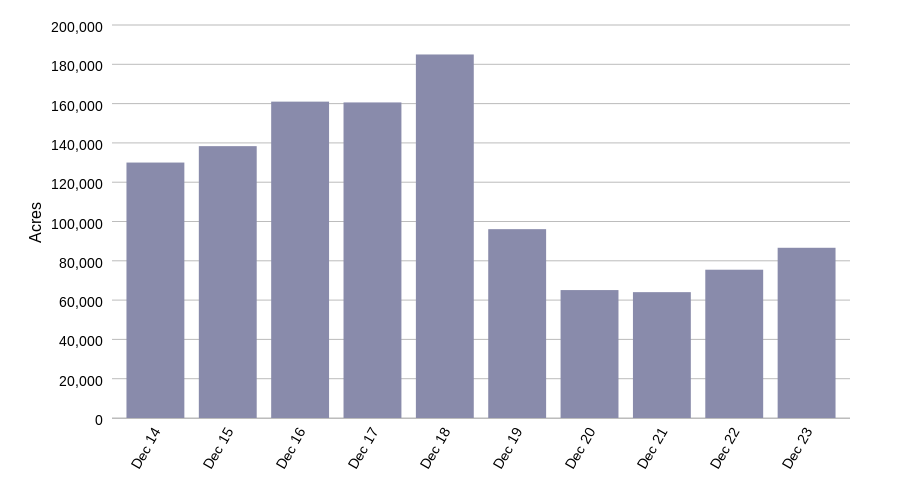
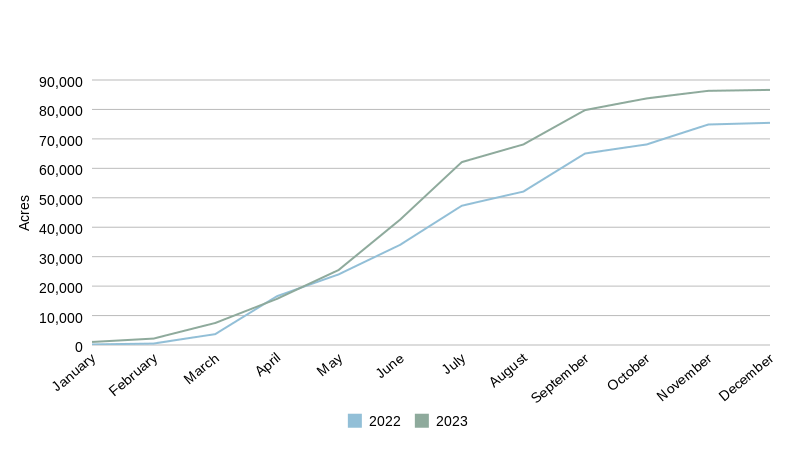
New, publicly marketed farmland supply in 2023 totalled 86,627 acres, 14.8% higher than the 2022 total of 75,459 acres. Following seasonal trends, there was an influx of new launches from April, albeit at a faster rate than recent years. From the start of April until the end of August, the volume of supply coming to the market was 25.2% greater than the previous year. Yet this decelerated from September, with monthly volumes to the close of the year 20.7% lower than the same period in 2022.
Rocketing interest rates are partly to blame for the uptick in supply, as debt pressures led to more businesses offloading holdings either in part or in full. However, the Bank of England has held the base rate at 5.25% since August, and it is likely that interest rates have now peaked. Although strong wage growth and other inflationary pressures suggest the base rate will be slow to come down, expectations of cuts in 2024 have had a positive influence on market sentiment and moderated the number of debt-driven launches.
Although annual supply levels in 2023 were 11.8% higher than the five-year average of 77,467 acres, it is evident that there is still an acute stock shortage by longer-term standards. Publicly advertised supply in 2023 fell 25.5% below the ten-year average and 34.2% below the twenty-year average. Agricultural land is being increasingly offered off-market, and so this does not provide a complete picture. Yet, even when taking this into account, there are noticeably fewer opportunities for buyers. Coupled with robust demand, land values are likely to continue to rise.
Decelerating supply and accelerating structural change
Commodity price trends

Sheep
Chicken

£1,000
£2,250
£1,700
0.0%
7.9%
Hill
£500
£1,500
£1,000
0.0%
0.0%
Hill
£1,800
£2,900
£2,250
0.0%
4.7%
Hill
£11,000
£14,000
£12,500
0.0%
2.0%
Lifestyle
£1,800
£3,850
£2,750
0.0%
5.8%
Hill
£10,750
£15,750
£13,250
0.0%
1.9%
Lifestyle
£11,000
£13,000
£12,000
0.0%
0.0%
Yorkshire Wolds
£13,250
£25,000
£16,750
0.0%
0.0%
Lifestyle
£8,000
£14,000
£10,000
0.0%
11.1%
Silts and Fen
£25,000
£16,000
0.0%
0.0%
Lifestyle
£13,500
£25,000
£17,000
1.5%
1.5%
Lifestyle
£8,000
£14,000
£10,250
2.5%
10.8%
Silts and Fen
£16,000
£35,000
£22,500
0.0%
12.5%
Lifestyle

SHEEP
Unit
Latest data
Date
Quarterly change
Annual change
pence/kg dw
587.1
Dec '23
6.8%
8.0%

CHICKEN
Unit
Latest data
Date
Quarterly change
Annual change
pence/kg dw
383.0
Dec '23
-0.3%
8.8%
EMAIL SOPHIE
020 7493 0685
Senior Research Analyst
Sophie Davidson


FIGURE 2: Annualised Growth of Average Land Values in England and Wales
to December 2023
FIGURE 3: Annual Publicly Marketed Farmland Supply
FIGURE 2
Annualised Growth of Average Land Values in England and Wales
FIGURE 1
FIGURE 1: Average Land Values in England and Wales
South East land values
The last quarter of the year saw a further correction in the imbalance between input and output prices. Despite hostilities in the Red Sea, wholesale oil markets have fallen sharply, providing much-needed relief to a generally energy-intensive sector. There were concerns in Q4 that prices would spike as tankers were diverted around the Cape of Good Hope, adding thousands of miles to journeys and disrupting supply chains. However, lower demand and increased output by some OPEC+ members have offset the impact of these influences. In the three months to December, crude oil (£/barrel) plummeted by 18.1%, marking the steepest quarterly decline of 2023. Annually, prices are 4.6% lower, and have fallen 34.6% overall from their peak in June 2022. After a brief uptick in October, red diesel prices also fell, ending the quarter 6.0% lower. Compared to Q4 2022, red diesel prices were down 21.5%.
Changes to fertiliser prices mirror this fall in fuel prices, due to reduced production costs. Ammonium nitrate fertiliser (imported) prices fell by 2.3% across the quarter and are down by a significant 49.5% compared with the same period last year. Prices are likely to remain volatile as the UK continues to rely on imports, but hopefully will not return to anywhere near the levels seen in 2022 in the near-term.
FIGURE 4: Cumulative publicly marketed farmland supply
FIGURE 3: Year-to-date publicly marketed farmland supply


Cumulative publicly
marketed farmland supply
FIGURE 4
Year-to-date publicly
marketed farmland supply
FIGURE 3
Year-to-Date Publicly
Marketed Farmland Supply
FIGURE 3
Cumulative Publicly
Marketed Farmland Supply
FIGURE 4
£12,500
£9,000
Average Land Values in
England and Wales
Annualised Growth of Average Land Values in England and Wales


Carter Jonas continues to monitor the changing nature of the farmland market and the influences on land values in England and Wales.
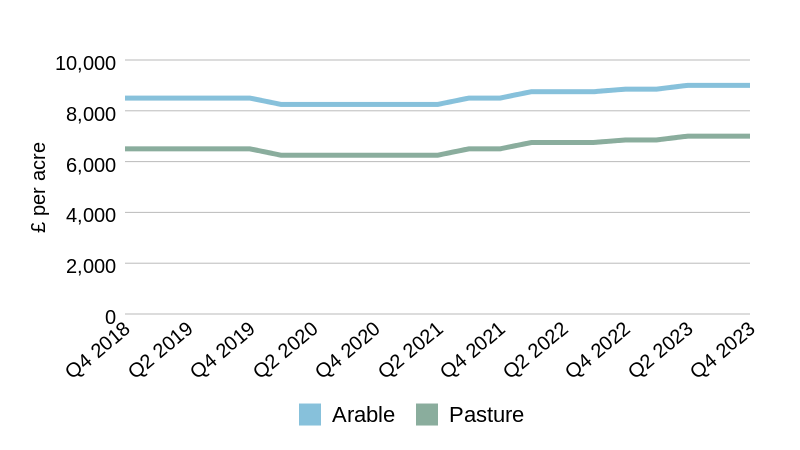
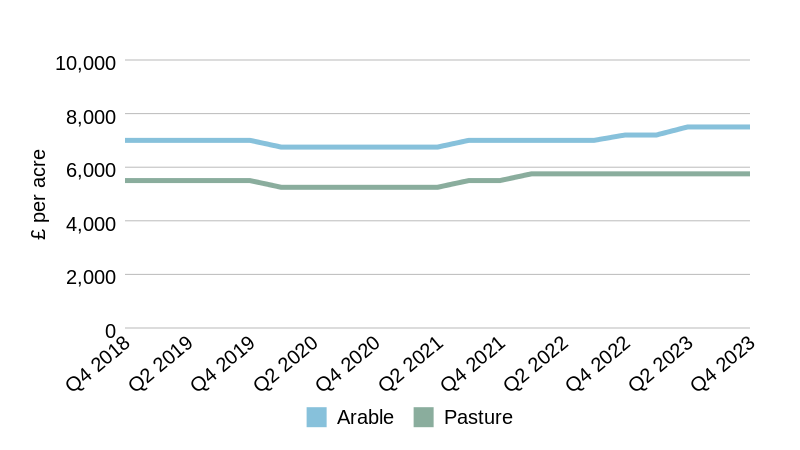
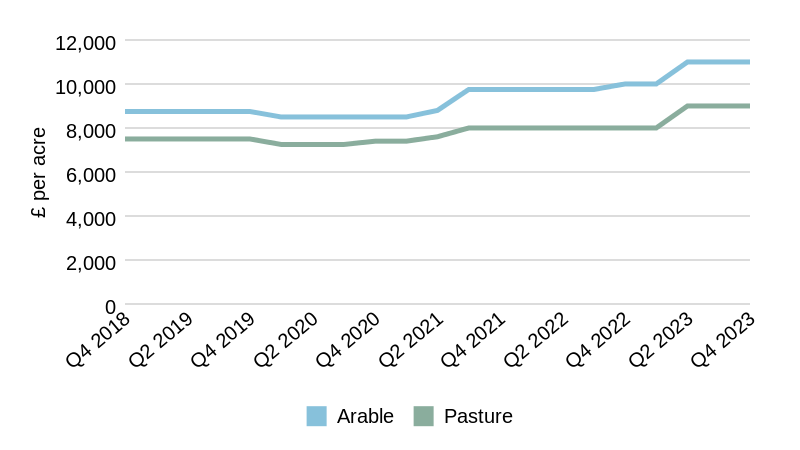
Rural land of all quality had a positive year, albeit with some outperforming others. Most notably, growth in tertiary pasture land values continues to outpace average and prime land. This type of land is typically lower quality and historically may have had limitations due to location, condition and access. Although growth is down slightly from last year, tertiary pasture land increased in value by 5.3% in 2023, compared to 3.7% for both average and prime pasture land.
Tertiary pasture land values have been bolstered by increases in the south and the East of England, and led predominantly by natural capital markets and alternative purchasers. Not only did these regions see the greatest proportion of new construction starts in 2023 (48.4% of all construction starts in England; Glenigan), but they are also leading the way in enhanced biodiversity net gain (BNG) policies. These factors have fuelled the growth of the private BNG market in these regions, as there is higher demand for lower quality land which creates opportunities for high-impact habitat creation and enhancement. The introduction of mandatory BNG in February 2024 will act as a powerful catalyst to accelerate the demand for land for environmental gains, putting continued upward pressure on pasture land values.
Domestic wheat prices made modest gains in Q4, ending the quarter up 1.9% on Q3. In the short-term, slight tightening of UK supply in 2023 has supported domestic prices. Estimates from Defra show that 2023 wheat production decreased by 10.0% on 2022, with farmers drilling more barley and oilseed rape instead. However, a boost in wheat exports through the Black Sea has renewed competitiveness in global markets. Year-on-year, prices are 27.8% lower, aiding profit margins for farmers purchasing for feed, while negatively affecting UK producers. Looking ahead, wetter-than-usual weather conditions have impacted winter wheat planting across Europe, which could lead to a tighter supply next season.
Despite a 3.1% decline in oilseed prices between September and October, domestic prices rebounded to finish the quarter unchanged from the previous quarter. However, prices remain substantially lower year-on-year, ending 2023 down 28.8% from 2022. Although increased global output, particularly from Ukraine, exerted downward pressure on UK oilseed prices, a significant yield decline of 18.8% on 2022 levels (despite a 6.1% expansion in cropping area; Defra) limited domestic supply and prevented prices from falling.
The UK livestock market saw mixed results again this quarter. Buoyed by seasonal demand, beef prices increased by 2.2% after a slight dip last quarter. Annually, prices have increased by 9.4%. According to data from Defra, the UK breeding herd contracted by 1.9% in the year to June 2023, extending the decline for 7 consecutive years. This is likely driven by surging fuel and feed costs, and may have implications for future production.
Sheep prices also pushed upwards, rising by 6.8% in the three months to December, and by 8.0% over 12 months. UK sheep and lamb numbers shrank by 4.1% in 2023 to their lowest in 12 years, supporting prices for producers.
Key data and expert commentary
outlining trends in the farmland market

(Please view desktop version for graphs)

£9,583
per acre
Average
arable land
value in Q4
Q-ON-Q
CHANGE
+0.7%
+3.8%


y-ON-y
CHANGE

£7,750
per acre
Average
pasture land
value in Q4


Q-ON-Q
CHANGE
+0.9%
+3.7%
y-ON-y
CHANGE
Source: Carter Jonas, AHDB, Farmers Weekly, DEFRA, ONS, OPEC
Commodity price trends
A rebalancing of commodity prices
Inputs
Outputs


Crude Oil
Fertiliser
Red Diesel
Milk
Beef
Feed Wheat
Oilseed Rape
Pork
Sheep
Chicken

CRUDE OIL
Unit
Latest data
Date
Quarterly change
Annual change
£/barrel
62.4
Dec '23
-18.1%
-4.6%

Fertiliser
Unit
Latest data
Date
Quarterly change
Annual change
£/tonne
353.9
Dec '23
-2.3%
-49.5%

Red Diesel
Unit
Latest data
Date
Quarterly change
Annual change
pence/litres
83.8
Dec '23
-6.0%
-21.5%

Feed Wheat
Unit
Latest data
Date
Quarterly change
Annual change
£/tonne
195.3
Dec '23
1.9%
-27.8%

OILSEED RAPE
Unit
Latest data
Date
Quarterly change
Annual change
£/tonne
376.0
Dec '23
0.0%
-28.8%

MILK
Unit
Latest data
Date
Quarterly change
Annual change
pence/litre
37.0
Oct '23
2.5%
-26.9%

BEEF
Unit
Latest data
Date
Quarterly change
Annual change
pence/kg dw
486.3
Dec '23
2.2%
9.4%

Pork
Unit
Latest data
Date
Quarterly change
Annual change
pence/kg dw
210.6
Dec '23
-3.9%
4.6%

SHEEP
Unit
Latest data
Date
Quarterly change
Annual change
pence/kg dw
587.1
Dec '23
6.8%
8.0%

CHICKEN
Unit
Latest data
Date
Quarterly change
Annual change
pence/kg dw
383.0
Dec '23
-0.3%
8.8%
Tap a trend for more info

Tap a location for
a local overview


WEST MIDLANDS

NORTH EAST

SOUTH WEST

WALES

NORTH WEST

YORKSHIRE & HUMBER

EAST MIDLANDS

EAST OF ENGLAND

SOUTH EAST
2019
CLOSE

View on desktop for a full overview
North West land values
2019
CLOSE

View on desktop for a full overview
01423 707801
Associate
Sam Johnson


EMAIL Sam
North East land values
2019
CLOSE

View on desktop for a full overview
01423 707801
Associate Partner
Sam Johnson


EMAIL Sam
Yorkshire & The Humber land values
2019
CLOSE

View on desktop for a full overview

EMAIL Hugh
01248 360417
Partner
Hugh O' Donnell

Wales land values
2019
CLOSE

View on desktop for a full overview
East Midlands land values
2019
CLOSE

EMAIL EDWARD
01213 899685
Senior Surveyor
Angharad Llewellyn

View on desktop for a full overview
West Midlands land values
2019
CLOSE

View on desktop for a full overview
East of England land values
2019
CLOSE

View on desktop for a full overview
07880 084633
Partner
Andrew Chandler

EMAIL Andrew
South East land values
2019
CLOSE

View on desktop for a full overview

EMAIL david
01962 833386
Partner
David Hebditch

South West land values

Get in touch
020 7493 0685
Senior Research Analyst
Sophie Davidson

EMAIL SOPHIE

EMAIL Andrew

07880 084633
Head of Rural Agency
Andrew Chandler
Please note that values vary depending on the quality of the land and local dynamics, among many other factors. Speak to your regional expert (at the bottom of this page) for location-specific advice.
Public environmental schemes, too, will also play an increasing role in the sector. At the close of the year, the Basic Payment Scheme ended and transitioned to delinked payments, with payments in 2024 now halved from before the phase out. Simultaneously, at the Oxford Farming Conference at the start of January, the Environment Secretary unveiled improvements to the Environmental Land Management schemes (ELMs). This included increases in payment rates (averaging a 10% uplift) and new actions. While the details of the new actions are outstanding, many businesses have started to use the schemes to complement the farm’s bottom line and will continue to do so at an increasing rate.
Meanwhile, chicken prices were down quarter-on-quarter, albeit by a marginal 0.3%. However, prices have grown annually by a strong 8.8%. Following a similar trend, the number of chickens (broilers) contracted by 4.3% in the year to June 2023.
Pork prices also fell, ending the quarter 3.9% down on the previous quarter. Yet, year-on-year, prices are 4.6% higher. The number of pigs fell the steepest of all livestock populations, decreasing by 10.3% in the 12 months to June 2023 to its lowest level since 2012. Yet, cheap EU imports continue to hinder the prices domestic producers can achieve.
Although, at the time of writing, Defra's official farmgate milk prices only extend to October, producer movements indicate a range of price changes since then. In the three months to October, Defra data shows that average prices increased by 2.5%, although down by a substantial 26.9% year-on-year. November saw price reductions from some milk producers, followed by relative stability in December. At the start of January 2024, however, some processors increased prices, which could be an early indicator of improvement for dairy farmers.
Over the longer term, some output prices are now outpacing growth in inputs. Input costs like crude oil (up 39.1%), red diesel (34.4%), and fertiliser (29.3%) have soared over the past 5 years, but output prices for some livestock have outpaced that growth. Pork prices have seen the steepest growth (43.8%), followed by sheep (42.9%) and chicken (41.9%). Beef inflation (37.6%) falls just behind fuel prices, while milk prices (17.7%) lag significantly, creating a disparity in profitability
across producers.
South East


Farmland Market Update

Which local authorities are raising the bar for biodiversity?
Read our analysis on the practical implications of BNG in different parts of the country.

Which local authorities are raising the bar for biodiversity?
Read our analysis on the practical implications of BNG in different parts of the country.
Meanwhile, chicken prices were down quarter-on-quarter, albeit by a marginal 0.3%. However, prices have growth annually by a strong 8.8%. Following a similar trend, the number of chickens (broilers) contracted by 4.3% in the year to June 2023.
Pork prices also fell, ending the quarter 3.9% down on the previous quarter. Yet, year-on-year, prices are 4.6% higher. The number of pigs fell the steepest of all livestock populations, decreasing by 10.3% in the 12 months to June 2023 to its lowest level since 2012. Yet, cheap EU imports continue to hinder the prices domestic producers can achieve.
Although, at the time of writing, Defra's official farmgate milk prices only extend to October, producer movements indicate a range of price changes since then. In the three months to October, Defra data shows that average prices increased by 2.5%, although down by a substantial 26.9% year-on-year. November saw price reductions from some milk producers, followed by relative stability in December. At the start of January 2024, however, some processors increased prices, which could be an early indicator of improvement for dairy farmers.
Over the longer term, some output prices are now outpacing growth in inputs. Input costs like crude oil (up 39.1%), red diesel (34.4%), and fertiliser (29.3%) have soared over the past 5 years, but output prices for some livestock have outpaced that growth. Pork prices have seen the steepest growth (43.8%), followed by sheep (42.9%) and chicken (41.9%). Beef inflation (37.6%) falls just behind fuel prices, while milk prices (17.7%) lag significantly, creating a disparity in profitability
across producers.


EMAIL Jamie
01223 346592
Senior Surveyor
Jamie Elbourn


EMAIL Jamie
01223 346592
Senior Surveyor
Jamie Elbourn


01423 707801
Associate Partner
Sam Johnson


EMAIL Sam