

Model Estate 2022
Welcome to the 2022 Model Estate research report, the twelfth annual publication produced by Carter Jonas, which documents the changing nature
of a rural estate and its diverse range of
income streams.
About the Model Estate
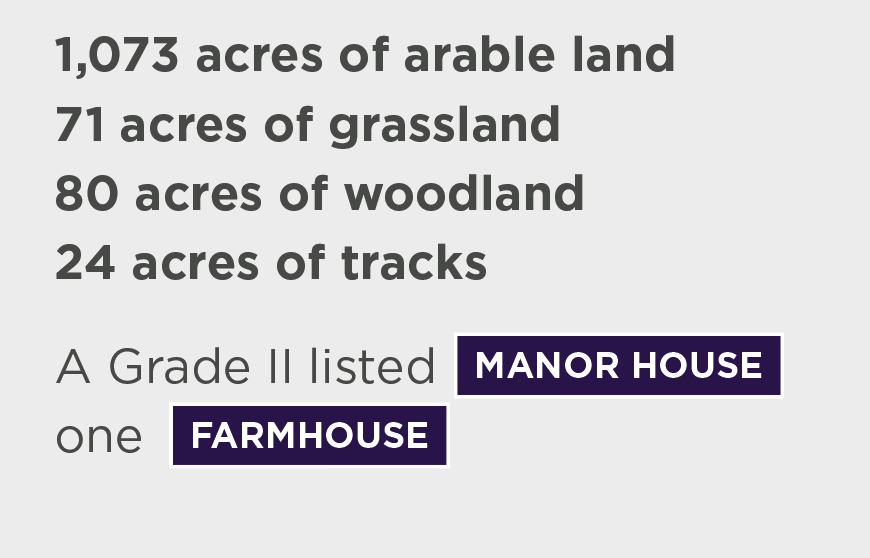
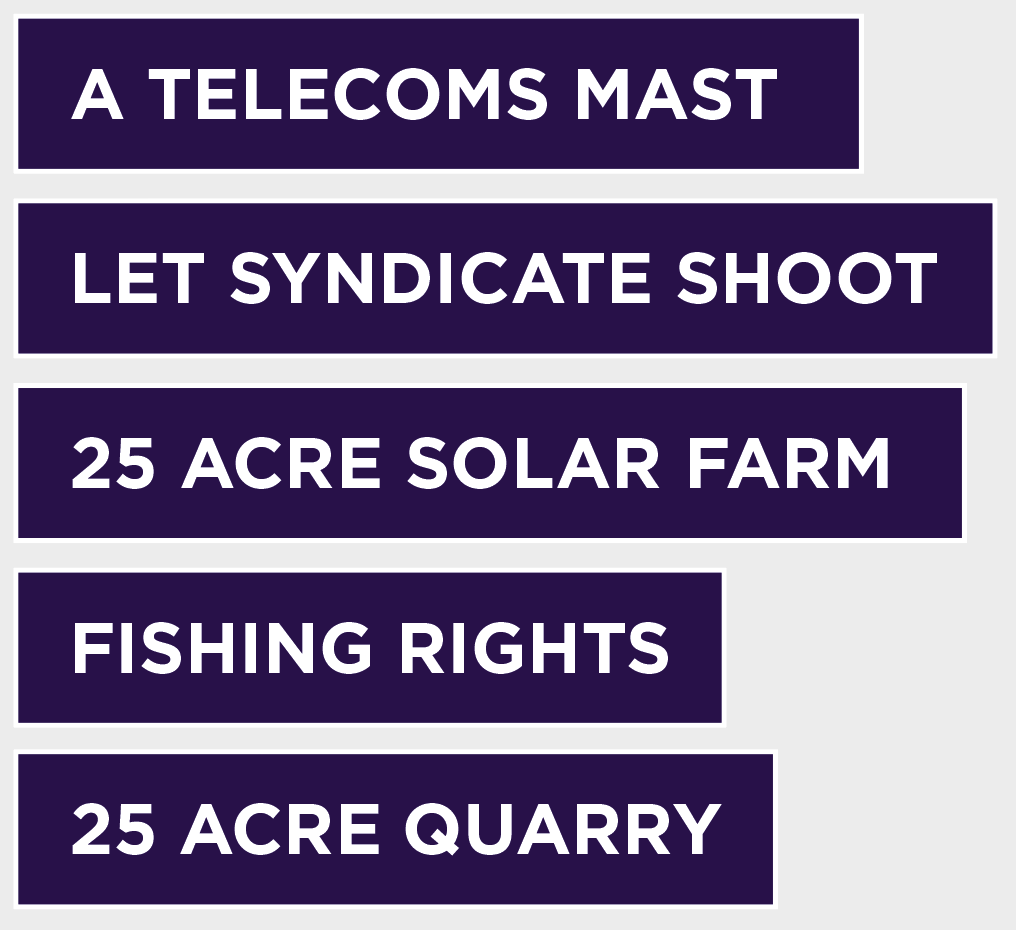
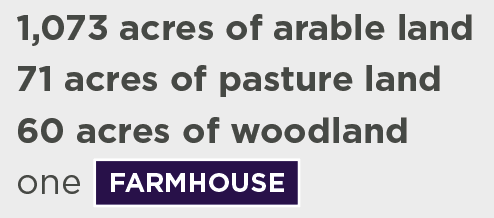
The Model Estate is a hypothetical agricultural estate created by Carter Jonas in 2010. The Estate has evolved over the years and currently comprises 3,273 acres and includes a combination of let and in-hand farms, a commercial and residential portfolio, a telecoms mast, fishing rights, a syndicate shoot, a solar farm, and a quarry. It is located within the geographical triangle bounded by the M4, M40 and M5 motorways.
Why was the Model Estate created?
Analysing the Estate’s data each year enables us to give a balanced view of all the assets and make strategic recommendations for the coming months, similar to the annual reviews produced by Carter Jonas for estates under our management.
The Model Estate is also used to compare the short- and long-term capital value performance of agricultural land and assets against a basket of alternative asset classes: residential and commercial property, equities, gold, fine wine and classic cars.
Please note that all findings in this report are based on valuations undertaken on 31 December 2021.
Components
Total value:
£46.88 million
The Model Estate was valued at £46.88m in December 2021, representing an annual increase of 5.7% against a value of £44.36m in 2020. The Estate has seen sustained growth over the last 10 years, with 10-year annualised growth at a
robust 4.7%.
A surge in value in the residential market has had a considerable impact on the overall capital value of the Estate. Similarly, there was a notable performance from the Manor House which, as a result, has been analysed
as a separate asset this year. Growth of the in-hand farm and let farms also contributed, while the commercial
and ‘other’ elements (including the quarry) were stagnant.
Manor House 17%
Let Farms 32%
In-hand farmland 25%
Let Commercial 8%
Let Residential 7%
Figure 1 Components of the Model Estate (by capital value)
Source: Carter Jonas


Let residential
Let commercial
In-hand farm
Let farms
MANOR HOUSE
FARMHOUSE
FARMHOUSE
MANOR HOUSE

AST
AST
FBT
FBT
FBT
FBT
Show all components
Performance
The easing of pandemic restrictions from the start of the year stimulated activity in various markets and, subsequently, fuelled a substantial uplift in the overall value of the Model Estate.
Economic turbulence returned at the close of the year with the rise of the Omicron variant, allied to soaring inflation. Although growth was positive overall, weaknesses in the economy, notably supply chain issues and resultant decrease in net trade has negatively impacted some elements of the estate. Coupled with incoming policy changes in the wider market, growth was constrained in the latter months.
Residential: 15.8%
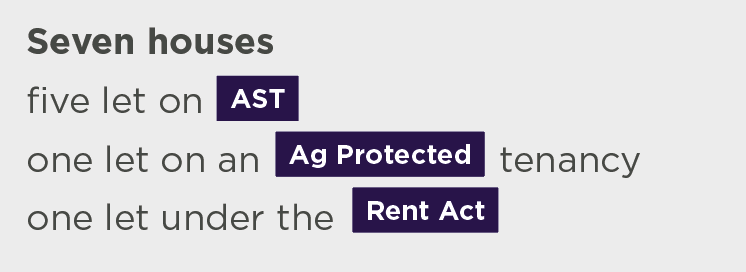
The capital value of the residential portfolio has increased substantially by 15.75% with a gross yield of 3.52% across the portfolio. Significant activity in the residential market at the start of the year has led to strong house price inflation, peaking at 13.5% in June (HM Land Registry) at the end of the first phase of the stamp duty holiday. However, demand did not drastically subside with the end of the tax break, falling to 10% in November (nationwide).
The private rented sector remained strong as the buyers’ market has become increasingly unaffordable. Rental demand and rental growth have seen regional differences, with the Model Estate benefitting from the sentiment of many wanting to live closer to the natural environment. Accordingly, a rent review at one of the two-bedroom properties has added a 10% uplift to the rental income.
One significant change was the passing of one of the secure tenants at Blackmore Vale Cottage, a 3-bed detached cottage on the edge of the Manor House grounds, which has since been refurbished and is now occupied by a family member. Curtailed by the global pandemic and lured by the draw of the countryside, the daughter has left London and returned to the Estate. Flexible working coupled with the want and need for more space will continue to help drive the residential market in the coming months.
Manor House: 12.8%
Like the let residential element of the Estate, the Manor House has benefitted from the successes of the housing market in 2021. More specifically, the prime country house market has outperformed other parts of the rural market in recent years. As such, analysis of the Manor House has been separated from the wider in-hand farm and residential component of
the Estate.
Where, in pre-pandemic years, the asset class had trailed behind others, a trend of off-market transactions has since helped strengthen this sector. Our analysis suggests that up to a 20% premium could have been achieved in the pandemic off-market.
However, there are signs that this has cooled somewhat and the ‘draw of London’ in this part of the country will return. We are reporting a market value of £7.55m (against last year’s value of £6.995m) which represents an 8.60% uplift in value in the year and a 13% uplift in its value since the start of the pandemic.
In-hand farmland: 4.9%
All elements of the in-hand farm have increased in value this year (despite 20 acres of amenity woodland being reallocated to the Manor House, being important to its setting).
We are reporting an overall farmland value of £9,550/acre, an uplift of 4.93% from 2020.
In line with the average values across England and Wales, the arable land within the Model Estate has increased by just over 5% in 2021 (the national average being 4.5%), increasing the value to £9,200/acre. Pasture has also recorded a strong rate of growth, with values of the Estate increasing by 6.85% in 2021 (against a national average of 6.2%), with the 71 acres of pasture now at £7,750/acre. Both arable land and pasture land have recorded their fastest rate of growth since 2016, marking a considerable turnaround from 2020, when average values fell by 1.3% and 1.0% for arable and pasture land respectively.
The rural land market has witnessed a sustained period of falling or stagnant pricing since the 2016 referendum on EU membership. In England, the increased clarity from the Government over the transition from the Basic Payment Scheme (BPS, which ends in 2027) to the new Environmental Land Management Scheme (ELMS) has brought renewed confidence to the market, fostering an improvement in outlook. We expect this will bring further price increases in the short-term.
Let Farms: 4.3%
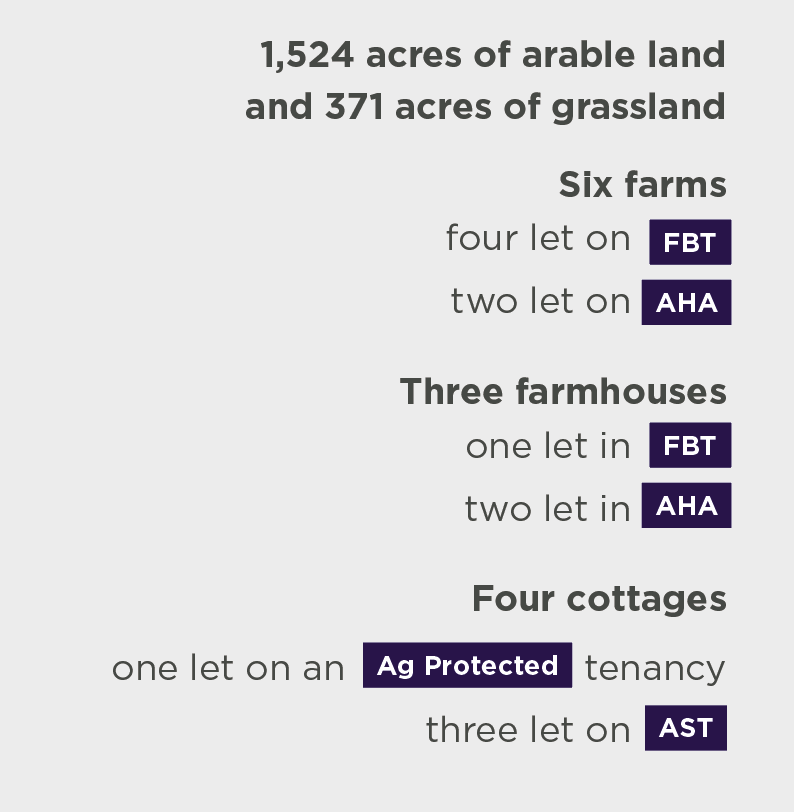
There has been little activity amongst the let farm assets in the last year with most tenant farmers hesitant to make drastic moves. Instead, they have been waiting to see what effect the removal of direct government support payments will have on the farmland rental market and what opportunities will arise with the emerging ELMS. There is talk amongst the tenants, however, that on neighbouring estates some farming tenants have served Rent Review notices with the expectation of agreeing reductions in the face of changing subsidies.
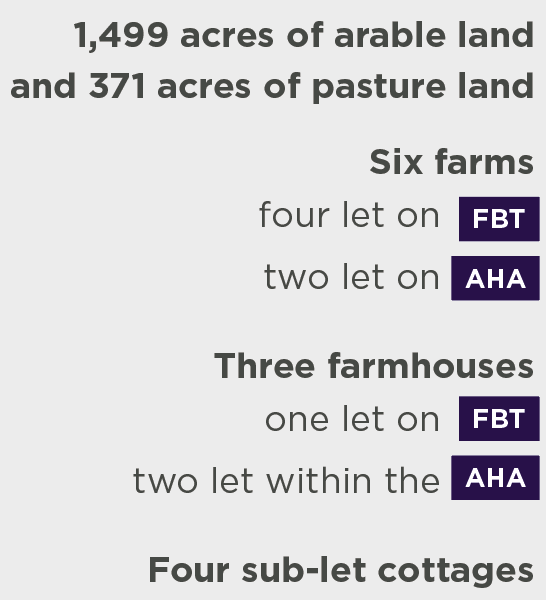
The AHA’86 farms have held firm in value at between 1.42% and 1.87% gross yield, although the reversion farmland values have crept up, meaning we are now reporting at around 60% of vacant possession values.
The trend for reducing FBT term lengths remains, with landowners avoiding longer term agreements whilst there remains such uncertainty around how agricultural policy will look in the short- to medium-term.
On the Estate, the 605 acres of bare arable and grassland let on FBTs averages a rent of £130/acre and are all on sub-3 year or periodic FBTs to three different farming businesses, providing gross yields of around 1.60%, reflecting the higher rental returns for FBTs (vs AHA’86 leases).
Overall, we are reporting a gross yield return of 1.68% across the 1,870 acres of let agricultural assets.
Read more on the Model Estate...

In response to widespread encouragement from trust advisors, the Estate has started considering its Natural Capital assets...

Natural Capital:
A New Asset Class
Component Performance
How did the Model Estate rank amongst the alternative asset classes?
Alternative Asset
Class Rankings


Scroll to explore

Scroll to explore
For an interactive map showing all of the components of the Model Estate 2022 visit this page on desktop
Annual change:
+5.7%
Contact us for more information
EMAIL SOPHIE
020 7493 0685
Senior Research Analyst
Sophie Davidson

EMAIL CHRIS
01865 404484
Rural Partner
Christopher Rhodes


EMAIL TIM
01223 346609
Head of Rural
Tim Jones


EMAIL TIM

01223 346609
Head of Rural Division
Tim Jones

Contact us for
more information
Traditional rural estates have, historically, been attractive to investors and high-net-worth buyers as they provide safe and consistent assets, whilst often providing exceptional family homes and other amenity interests. Such multi-asset class estates are also partially protected from income volatility due to the diversity of assets across many property sectors including residential, commercial, renewable, minerals and agriculture.
Whilst there remains uncertainty in the wider economy, many rural estates will continue to provide opportunities for capital growth through development and asset release opportunities. This includes the release of farms and residential properties from multi-generational occupation arrangements or restructuring holdings which may release valuable farmstead sites or strategic land for development.
Other 11%
Manor House: 12.8%
Like the let residential element of the Estate, the Manor House has benefitted from the successes of the housing market in 2021. More specifically, the prime country house market has outperformed other parts of the rural market in recent years. As such, analysis of the Manor House has been separated from the wider in-hand farm and residential component of the Estate.
Where, in pre-pandemic years, the asset class had trailed behind others, a trend of off-market transactions has since helped strengthen this sector. Our analysis suggests that up to a 20% premium could have been achieved in the pandemic off-market.
However, there are signs that this has cooled somewhat and the ‘draw of London’ in this part of the country will return. We are reporting a market value of £7.55m (against last year’s value of £6.995m) which represents an 8.60% uplift in value in the year and a 13% uplift in its value since the start of the pandemic.
In-hand farmland: 4.9%
All elements of the in-hand farm have increased in value this year (despite 20 acres of amenity woodland being reallocated to the Manor House, being important to its setting). We are reporting an overall farmland value of £9,550/acre, an uplift of 4.93% from 2020.
In line with the average values across England and Wales, the arable land within the Model Estate has increased by just over 5% in 2021 (the national average being 4.5%), increasing the value to £9,200/acre. Pasture has also recorded a strong rate of growth, with values of the Estate increasing by 6.85% in 2021 (against a national average of 6.2%), with the 71 acres of pasture now at £7,750/acre. Both arable land and pasture land have recorded their fastest rate of growth since 2016, marking a considerable turnaround from 2020, when average values fell by 1.3% and 1.0% for arable and pasture land respectively.
The rural land market has witnessed a sustained period of falling or stagnant pricing since the 2016 referendum on EU membership. In England, the increased clarity from the Government over the transition from the Basic Payment Scheme (BPS, which ends in 2027) to the new Environmental Land Management Scheme (ELMS) has brought renewed confidence to the market, fostering an improvement in outlook. We expect this will bring further price increases in the short-term.
"Both arable land and pasture land have recorded their fastest rate of growth since 2016"
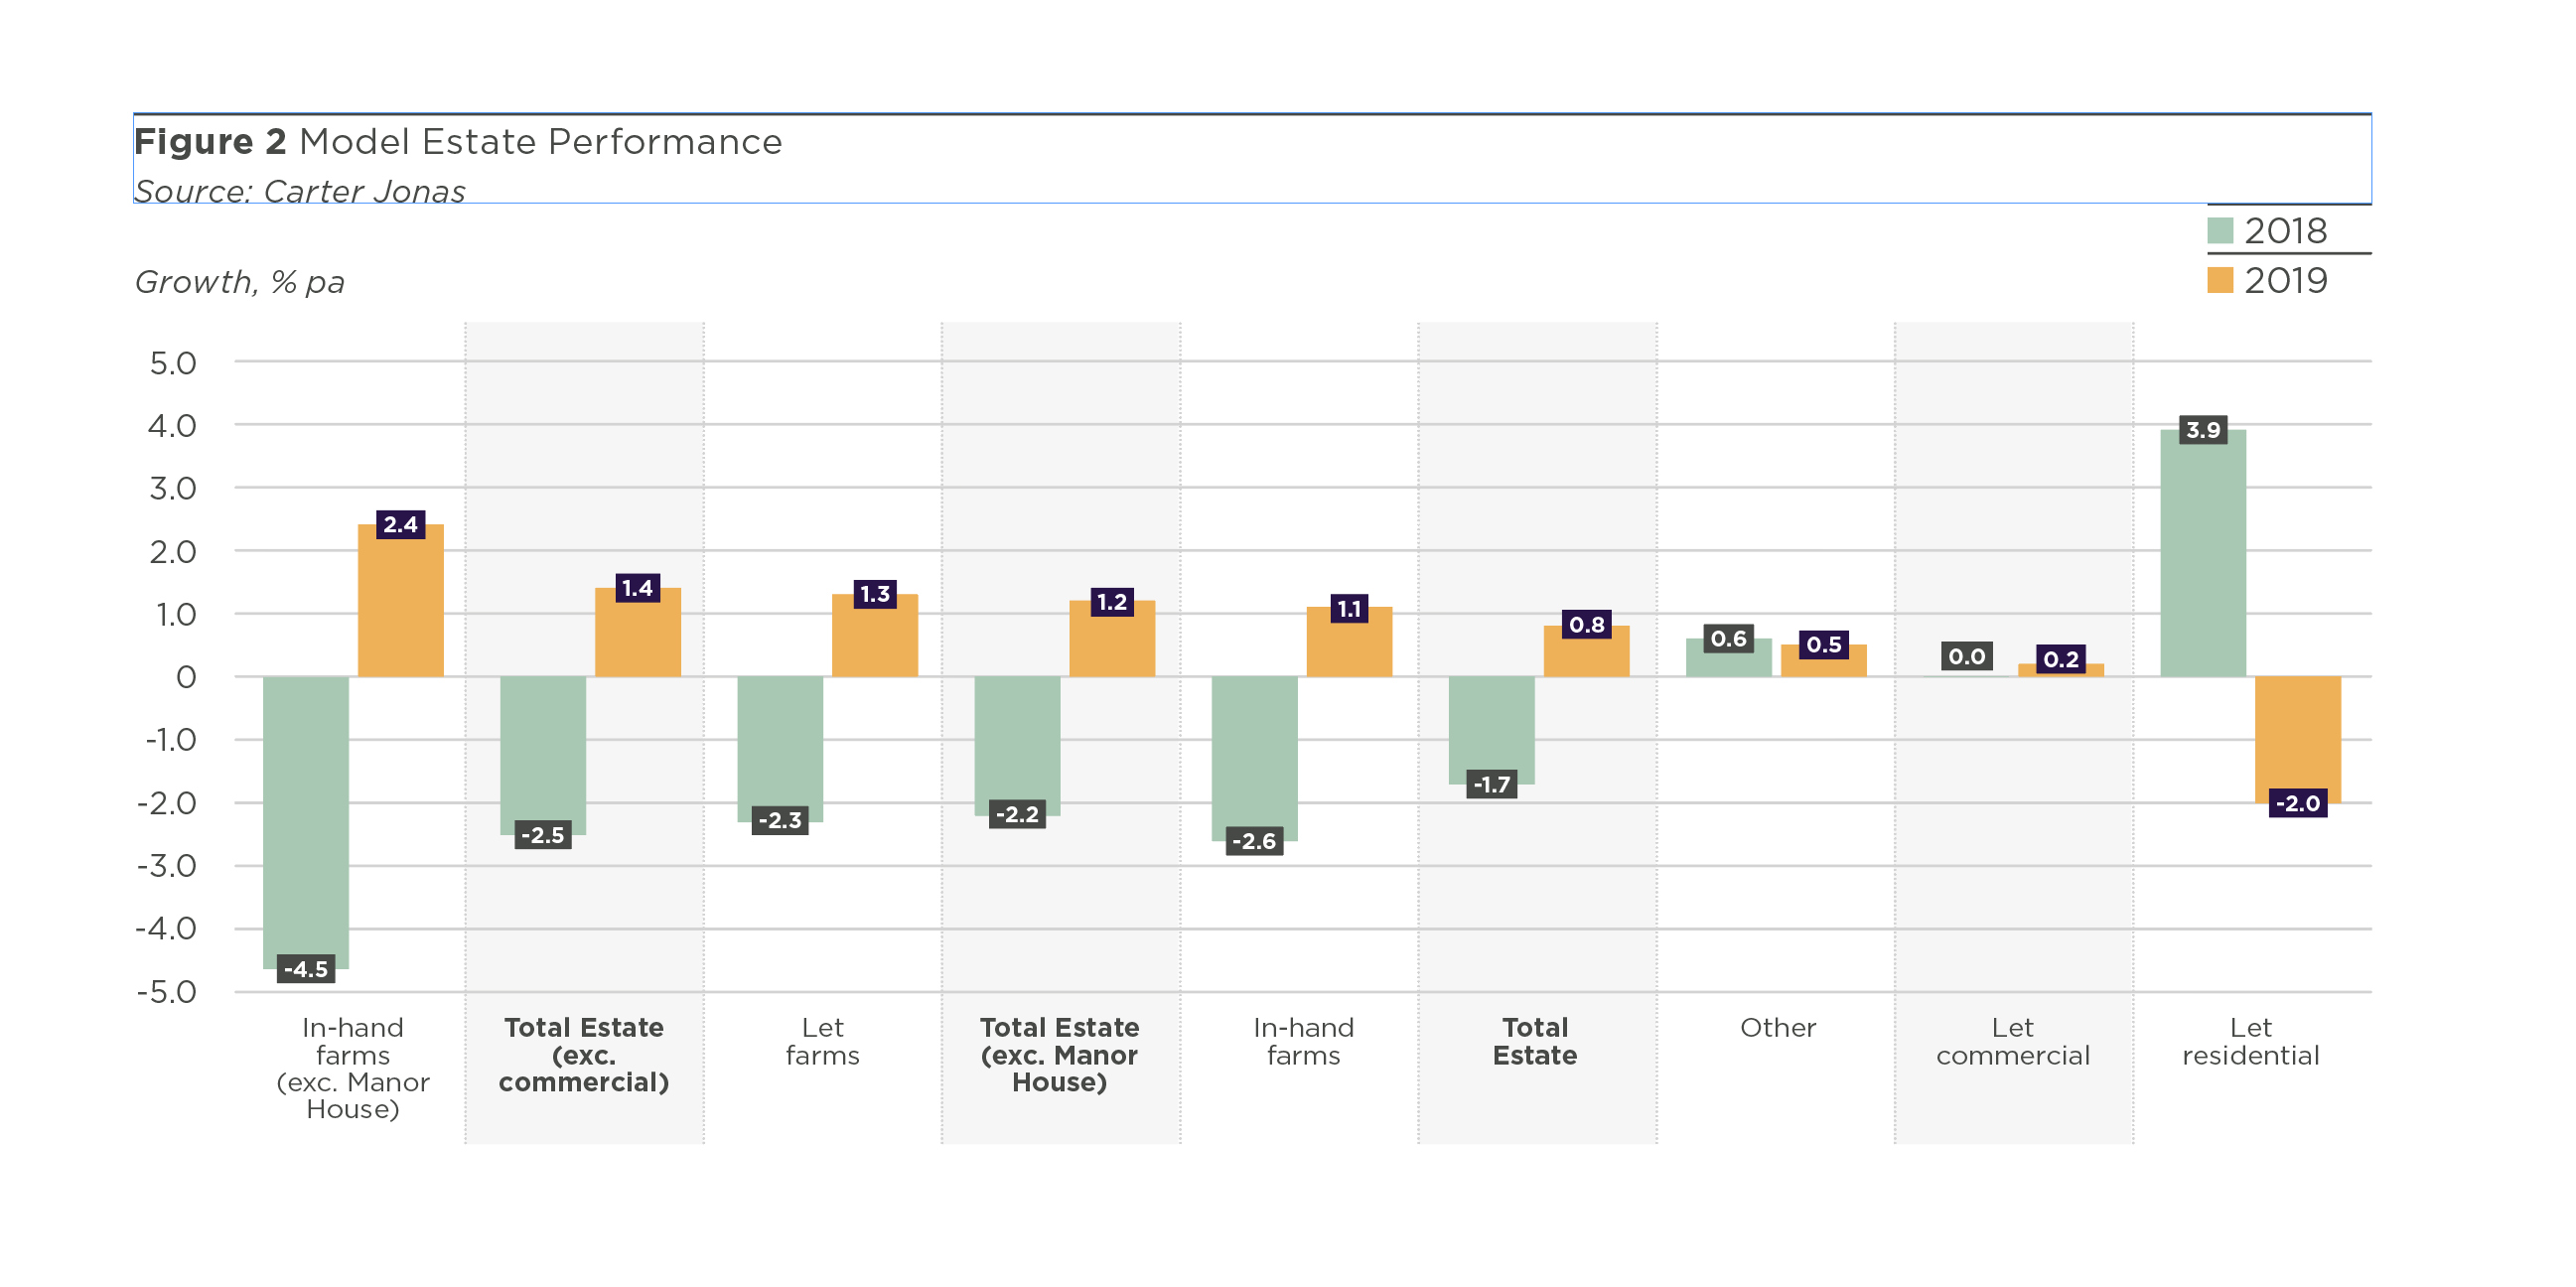
Figure 2 Model Estate Performance, 31 December 2021
Source: Carter Jonas
Let farms: 4.3%
There has been little activity amongst the let farm assets in the last year with most tenant farmers hesitant to make drastic moves. Instead, they have been waiting to see what effect the removal of direct government support payments will have on the farmland rental market and what opportunities will arise with the emerging ELMS. There is talk amongst the tenants, however, that on neighbouring estates some farming tenants have served Rent Review notices with the expectation of agreeing reductions in the face of changing subsidies.
The AHA’86 farms have held firm in value at between 1.42% and 1.87% gross yield, although the reversion farmland values have crept up, meaning we are now reporting at around 60% of vacant possession values.
The trend for reducing FBT term lengths remains, with landowners avoiding longer term agreements whilst there remains such uncertainty around how agricultural policy will look in the short- to medium-term.
On the Estate, the 605 acres of bare arable and grassland let on FBTs averages a rent of £130/acre and are all on sub-3 year or periodic FBTs to three different farming businesses, providing gross yields of around 1.60%, reflecting the higher rental returns for FBTs (vs AHA’86 leases).
Overall, we are reporting a gross yield return of 1.68% across the 1,870 acres of let agricultural assets.
Commercial: 0.0%
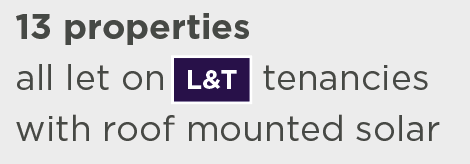
As in 2020, there was a consistent income from the commercial tenants in 2021. Providing a total of 50,000 sq ft across 13 units, the portfolio is relatively modest in scale. Although some tenants have left with resultant short-term void periods, the Estate was able to re-let vacant units promptly. Yields remain at an average 9.08% across the commercial portfolio with the capital value of £3,910,000 remaining unchanged.
The light industrial units, being former agricultural buildings as opposed to purpose-built commercial units, achieved rents of between £4.25/sq ft and £6.25/sq ft. The office properties are converted traditional barns and achieve rents in line with the wider rural office network at around £14.50/sq ft.
Industrial demand remains strong, with the pandemic accelerating the shift to e-commerce and increased need for storage space. As such, investor competition has stimulated sales volumes and elevated asset values. This is balanced out by the value of the office market, which has experienced turbulence with changing Government guidance to work from home. Many investors have been put-off by the uncertainty over the outlook for long-term occupier demand, and sales volumes have remained below pre-pandemic levels as a result.
Quarry: 0.0%
At the commencement of 2021, some concerns were presented by Quarry Co. to the Estate as to the impact of Covid-19 impositions on the development of the quarry. Fears were raised over the prospective negative impacts on trade at the newly established quarry, with impacts on production potentially prejudicing cash flow and the ability to service debt funded components of the Quarry Co. business. Positively, such forecasted fears did not fully materialise throughout the year and indeed, a bounce-back in productivity during the second half of the calendar year served to ensure that budgeted sales and revenue figures for the year were achieved. Specifically, demand for concrete from the batching plant facility located at the quarry was subject to a notable increase and it was the internal supply arrangement feeding mineral from the quarry to the batching plant that largely served to bolster reported mineral sales.
With production levels increasing to just under 250,000 tonnes of saleable sand and gravel, the impact on the working footprint of the quarry was notable and the requirement to progress soil stripping and preparatory works for the next phase of extraction was initiated during spring 2021. Consequentially, the total land-take arrangement under Quarry Co’s. lease has increased to some 65 acres. The increase in both mineral sales and the occupation of additional land by Quarry Co. has served to bolster the annual revenue due to the Estate under the lease during the 2021 calendar year. The total increase in revenues reported compared to the previous year equates to circa 25%.





Scroll to explore


Explore the Model Estate

SOLAR FARM
TELECOMS MAST
FISHING RIGHTS
SYNDICATE SHOOT
FISHING RIGHTS
TELECOMS MAST
SYNDICATE SHOOT
SOLAR FARM
Other
Other
MANOR HOUSE
FARMHOUSE
MANOR HOUSE
FARMHOUSE
In-hand farm
In-hand farm
Let commercial
Let commercial
AST
AST
FBT
FBT
FBT
FBT
Let farms
Let farms
Let residential
Let residential

Show all components
Growth % pa
Growth % pa
700
Other
Total
Estate
(exc. commercial
Total
Estate
(exc. Manor
House)
Total
Estate
Let Residential
Manor House
In-hand Farm
(exc. Manor House)
Let commercial
Let Farms
600
500
400
300
200
100
0
-100
6.2
4.4
5.7
15.8
12.8
4.3
4.9


Total
Estate
(exc. commercial
Total
Estate
(exc. Manor
House)
Let Residential
In-hand Farmland
Manor House
Total Estate
Let commercial
Let Farms
16
14
12
8
10
6
4
2
0
-2
-4
5.7
6.2
4.4
15.8
4.9
0.0
12.8
4.3


2021 change %
2020 change %
2019 change %
Manor House
Manor House


QUARRY


0.0
0.0
2021 change %
2020 change %
2019 change %


QUARRY
Please note that all findings in this report are based on valuations undertaken on 31 December 2021.

Other 11%

Component
Commercial: 0.0%
As in 2020, there was a consistent income from the commercial tenants in 2021. Providing a total of 50,000 sq ft across 13 units, the portfolio is relatively modest in scale. Although some tenants have left with resultant short-term void periods, the Estate was able to re-let vacant units promptly. Yields remain at an average 9.08% across the commercial portfolio with the capital value of £3,910,000 remaining unchanged.
The light industrial units, being former agricultural buildings as opposed to purpose-built commercial units, achieved rents of between £4.25/sq ft and £6.25/sq ft. The office properties are converted traditional barns and achieve rents in line with the wider rural office network at around £14.50/sq ft.
Industrial demand remains strong, with the pandemic accelerating the shift to
e-commerce and increased need for storage space. As such, investor competition has stimulated sales volumes and elevated asset values. This is balanced out by the value of the office market, which has experienced turbulence with changing Government guidance to work from home. Many investors have been put-off by the uncertainty over the outlook for long-term occupier demand, and sales volumes have remained below pre-pandemic levels as a result.
Quarry: 0.0%
At the commencement of 2021, some concerns were presented by Quarry Co. to the Estate as to the impact of Covid-19 impositions on the development of the quarry. Fears were raised over the prospective negative impacts on trade at the newly established quarry, with impacts on production potentially prejudicing cash flow and the ability to service debt funded components of the Quarry Co. business. Positively, such forecasted fears did not fully materialise throughout the year and indeed, a bounce-back in productivity during the second half of the calendar year served to ensure that budgeted sales and revenue figures for the year were achieved. Specifically, demand for concrete from the batching plant facility located at the quarry was subject to a notable increase and it was the internal supply arrangement feeding mineral from the quarry to the batching plant that largely served to bolster reported mineral sales.
With production levels increasing to just under 250,000 tonnes of saleable sand and gravel, the impact on the working footprint of the quarry was notable and the requirement to progress soil stripping and preparatory works for the next phase of extraction was initiated during spring 2021. Consequentially, the total land-take arrangement under Quarry Co’s. lease has increased to some 65 acres. The increase in both mineral sales and the occupation of additional land by Quarry Co. has served to bolster the annual revenue due to the Estate under the lease during the 2021 calendar year. The total increase in revenues reported compared to the previous year equates to circa 25%.


Growth % pa
Growth % pa
700
Other
Total
Estate
(exc. commercial
Total
Estate
(exc. Manor
House)
Total
Estate
Let Residential
Manor House
In-hand Farm
(exc. Manor House)
Let Commercial
Let Farms
600
500
400
300
200
100
0
-100
6.2
4.4
0.0
5.7
15.8
12.8
4.3
4.9
0.0
2021 change %
2020 change %
2019 change %
Total
Estate
(exc. commercial
Total
Estate
(exc. Manor
House)
Let Residential
In-hand Farmland
Manor House
Total Estate
Let Commercial
Let Farms
16
14
12
8
10
6
4
2
0
-2
-4
5.7
6.2
4.4
15.8
4.9
0.0
12.8
4.3


2021 change %
2020 change %
2019 change %
Other: 0.0%
The values of the telecoms mast, commercial shoot, solar farm and fishing rights have also remained stable over the last year.
Other: 0.0%
The values of the telecoms mast, commercial shoot, solar farm and fishing rights have also remained stable over the last year.
65
65