Land values:
the national view
Although the rate of annual growth in arable and pasture land values has moderated from its recent highs, land values have been on an upward trend for nearly four years. This demonstrates the resilience of the market and sustained investor confidence in farmland assets.
There is an increasing divergence in the growth in prime and secondary or tertiary land values. Prime values have seen the strongest growth, whilst lower quality land or that in less sought-after locations, have experienced a more modest growth rate. We expect this polarisation to continue
into 2025.
The Autumn Budget was of disappointment to the industry. However, we expect land values to remain stable in 2025 and do not anticipate a significant market reaction ahead of April 2026 (when the change is effective).
£9,722
per acre
Average arable land value in Q4
from
Q3 2024
0.0%
+1.4%

from
Q4 2023
£7,889
per acre
from
Q3 2024
0.0%
+1.8%
from
Q4 2023
Farmland
Market Update
Average farmland values in England and Wales held firm in the final quarter of the year but have increased on an annual basis. Despite ongoing and emerging challenges, farmland continues to be an attractive investment, drawing a diverse pool of buyers
with various motivations for purchase.

“Land value growth has not entered negative
territory in over three years.”
FIGURE 5
Commodity prices
Source: Carter Jonas, AHDB, Farmers Weekly, Defra, ONS, OPEC
Input
Outputs


CRUDE OIL
Unit
Latest data
Date
Quarterly change
Annual change
£/barrel
57.8
Dec' 24
3.8%
-7.4%
Fertiliser
Unit
Latest data
Date
Quarterly change
Annual change
£/tonne
333.6
Dec' 24
0.9%
-5.7%
Red Diesel
Unit
Latest data
Date
Quarterly change
Annual change
pence/litres
76.1
Dec' 24
1.2%
-9.2%
Feed Wheat
Unit
Latest data
Date
Quarterly change
Annual change
£/tonne
191.1
Dec' 24
-0.3%
-2.1%
oilseed rape
Unit
Latest data
Date
Quarterly change
Annual change
£/tonne
428.2
Dec' 24
7.5%
13.9%
MILK
Unit
Latest data
Date
Quarterly change
Annual change
pence/litre
45.2
Oct' 24
12.7%
21.8%
BEEF
Unit
Latest data
Date
Quarterly change
Annual change
pence/kg dw
547.7
Dec' 24
8.3%
12.6%
Pork
Unit
Latest data
Date
Quarterly change
Annual change
pence/kg dw
204.7
Dec' 24
-1.8%
-2.8%


Click a location for
a local overview


East of England
Arable
Pasture
£8,000
£7,000
£12,000
£9,500
£9,750
£8,000
0.0%
0.0%
5.4%
6.7%
Low
£ / acre
Prime
£ / acre
Average
£ / acre
Quarterly %
Annual %
East of England land values
North West
Arable
Low
£ / acre
Prime
£ / acre
£ / acre
Quarterly %
Annual %
Average
£8,000
£6,500
£12,000
£10,000
£10,000
£8,000
0.0%
0.0%
0.0%
0.0%
Pasture
North West land values
Wales
Arable
Low
£ / acre
Prime
£ / acre
£ / acre
Quarterly %
Annual %
Average
£8,250
£4,250
£10,000
£10,000
£8,500
£6,500
0.0%
0.0%
0.0%
0.0%
Pasture
EMAIL Hugh
01248 360417
Partner
Hugh O’Donnell

Wales land values

North East
Arable
Low
£ / acre
Prime
£ / acre
£ / acre
Quarterly %
Annual %
Average
£6,500
£4,250
£8,750
£6,500
£7,500
£5,750
0.0%
0.0%
0.0%
0.0%
Pasture
EMAIL Sam
01423 707801
Associate Partner
Sam Johnson
North East land values

Yorkshire and the Humber
Arable
Low
£ / acre
Prime
£ / acre
£ / acre
Quarterly %
Annual %
Average
£8,000
£5,500
£11,000
£7,250
£9,000
£7,000
0.0%
0.0%
0.0%
0.0%
Pasture
EMAIL Sam
01423 707801
Associate Partner
Sam Johnson
Yorkshire and the
Humber land values
East Midlands
Arable
Low
£ / acre
Prime
£ / acre
£ / acre
Quarterly %
Annual %
Average
£8,250
£7,250
£11,250
£9,250
£9,500
£8,250
0.0%
0.0%
2.7%
3.1%
Pasture
East Midlands land values
West Midlands
Arable
Low
£ / acre
Prime
£ / acre
£ / acre
Quarterly %
Annual %
Average
£9,500
£7,000
£14,000
£12,000
£11,500
0.0%
0.0%
4.5%
5.6%
Pasture
EMAIL EDWARD
0121 3060386
Associate Partner
Edward Beale
West Midlands land values
South East
Arable
Low
£ / acre
Prime
£ / acre
£ / acre
Quarterly %
Annual %
Average
£9,000
£8,000
£12,500
£9,500
£10,750
£9,000
0.0%
0.0%
0.0%
0.0%
Pasture
EMAIL Andrew
07880 084633
Partner
Andrew Chandler
Wales
West Midlands
East Midlands
South west
South east
East of england
Yorkshire & the humber
North east
North west
Get in touch
Hover over a trend for more info


South West
Arable
Low
£ / acre
Prime
£ / acre
£ / acre
Quarterly %
Annual %
Average
£10,000
£7,000
£12,000
£11,000
£11,000
£9,000
0.0%
0.0%
0.0%
0.0%
Pasture
EMAIL David

01823 428591
Partner
David Hebditch
South West land values
EMAIL Andrew
07880 084633
Head of Rural Agency
Andrew Chandler
New supply slowed in the second half of the year after an influx in the first half, ending the year broadly level with 2023. A promising pipeline of launches set for the spring is expected to be met by a healthy level of demand.
The industry is grappling with new challenges, including a new tax regime, increases to National Insurance contributions, higher minimum wages and sharper-than-expected cuts to direct payments. This is alongside ongoing challenges, notably labour shortages and fluctuating commodity prices.
Supply and
demand
Commodity price trends


£1,000
£2,250
£1,700
0.0%
0.0%
Hill
£500
£1,500
£1,000
0.0%
0.0%
Hill
£1,800
£2,900
£2,250
0.0%
0.0%
Hill
£11,000
£14,000
£12,500
0.0%
0.0%
Lifestyle
£1,800
£3,850
£2,750
0.0%
0.0%
Hill
£10,750
£15,750
£13,250
0.0%
0.0%
Lifestyle
£11,000
£13,000
£12,000
0.0%
0.0%
Yorkshire Wolds
£13,250
£25,000
£16,750
0.0%
0.0%
Lifestyle
£9,500
£16,000
£12,000
4.3%
20.0%
Silts and Fen
£25,000
£16,000
0.0%
0.0%
Lifestyle
£13,500
£25,000
£17,000
0.0%
0.0%
Lifestyle
£9,500
£16,000
£12,000
4.3%
17.1%
Silts and Fen
£16,000
£35,000
£22,500
0.0%
0.0%
Lifestyle
SHEEP
Unit
Latest data
Date
Quarterly change
Annual change
pence/kg dw
690.3
Dec' 24
7.1%
17.6%
CHICKEN
Unit
Latest data
Date
Quarterly change
Annual change
pence/kg dw
380.0
Nov' 24
-1.0%
-2.3%
EMAIL SOPHIE
020 7493 0685
Research Associate
Sophie Davidson

FIGURE 2: Annualised Growth of Average Land Values in England and Wales
FIGURE 1: Average Land Values in England and Wales
South East land values
FIGURE 4: Cumulative publicly marketed farmland supply
FIGURE 3: Year-to-date publicly marketed farmland supply
£12,500
£9,500

Carter Jonas continues to monitor the changing nature of the farmland market and the influences on land values in England and Wales.
Please note that values vary depending on the quality of the land and local dynamics, among many other factors. Speak to your regional expert (at the bottom of this page) for location-specific advice.
Land values:
the regional view


Q4 2024
Download the full report

Download the full report
Download the full report
Download the full report
For more commentary, download the full report as a PDF.
For more commentary, download the full report as a PDF.
Download the full report
For more commentary, download the full report as a PDF.
Average pasture land value in Q4
Explore the report
Land values: the national view | Land values: the regional view | Supply and demand | Commodity prices


For more commentary, download the full report as a PDF.

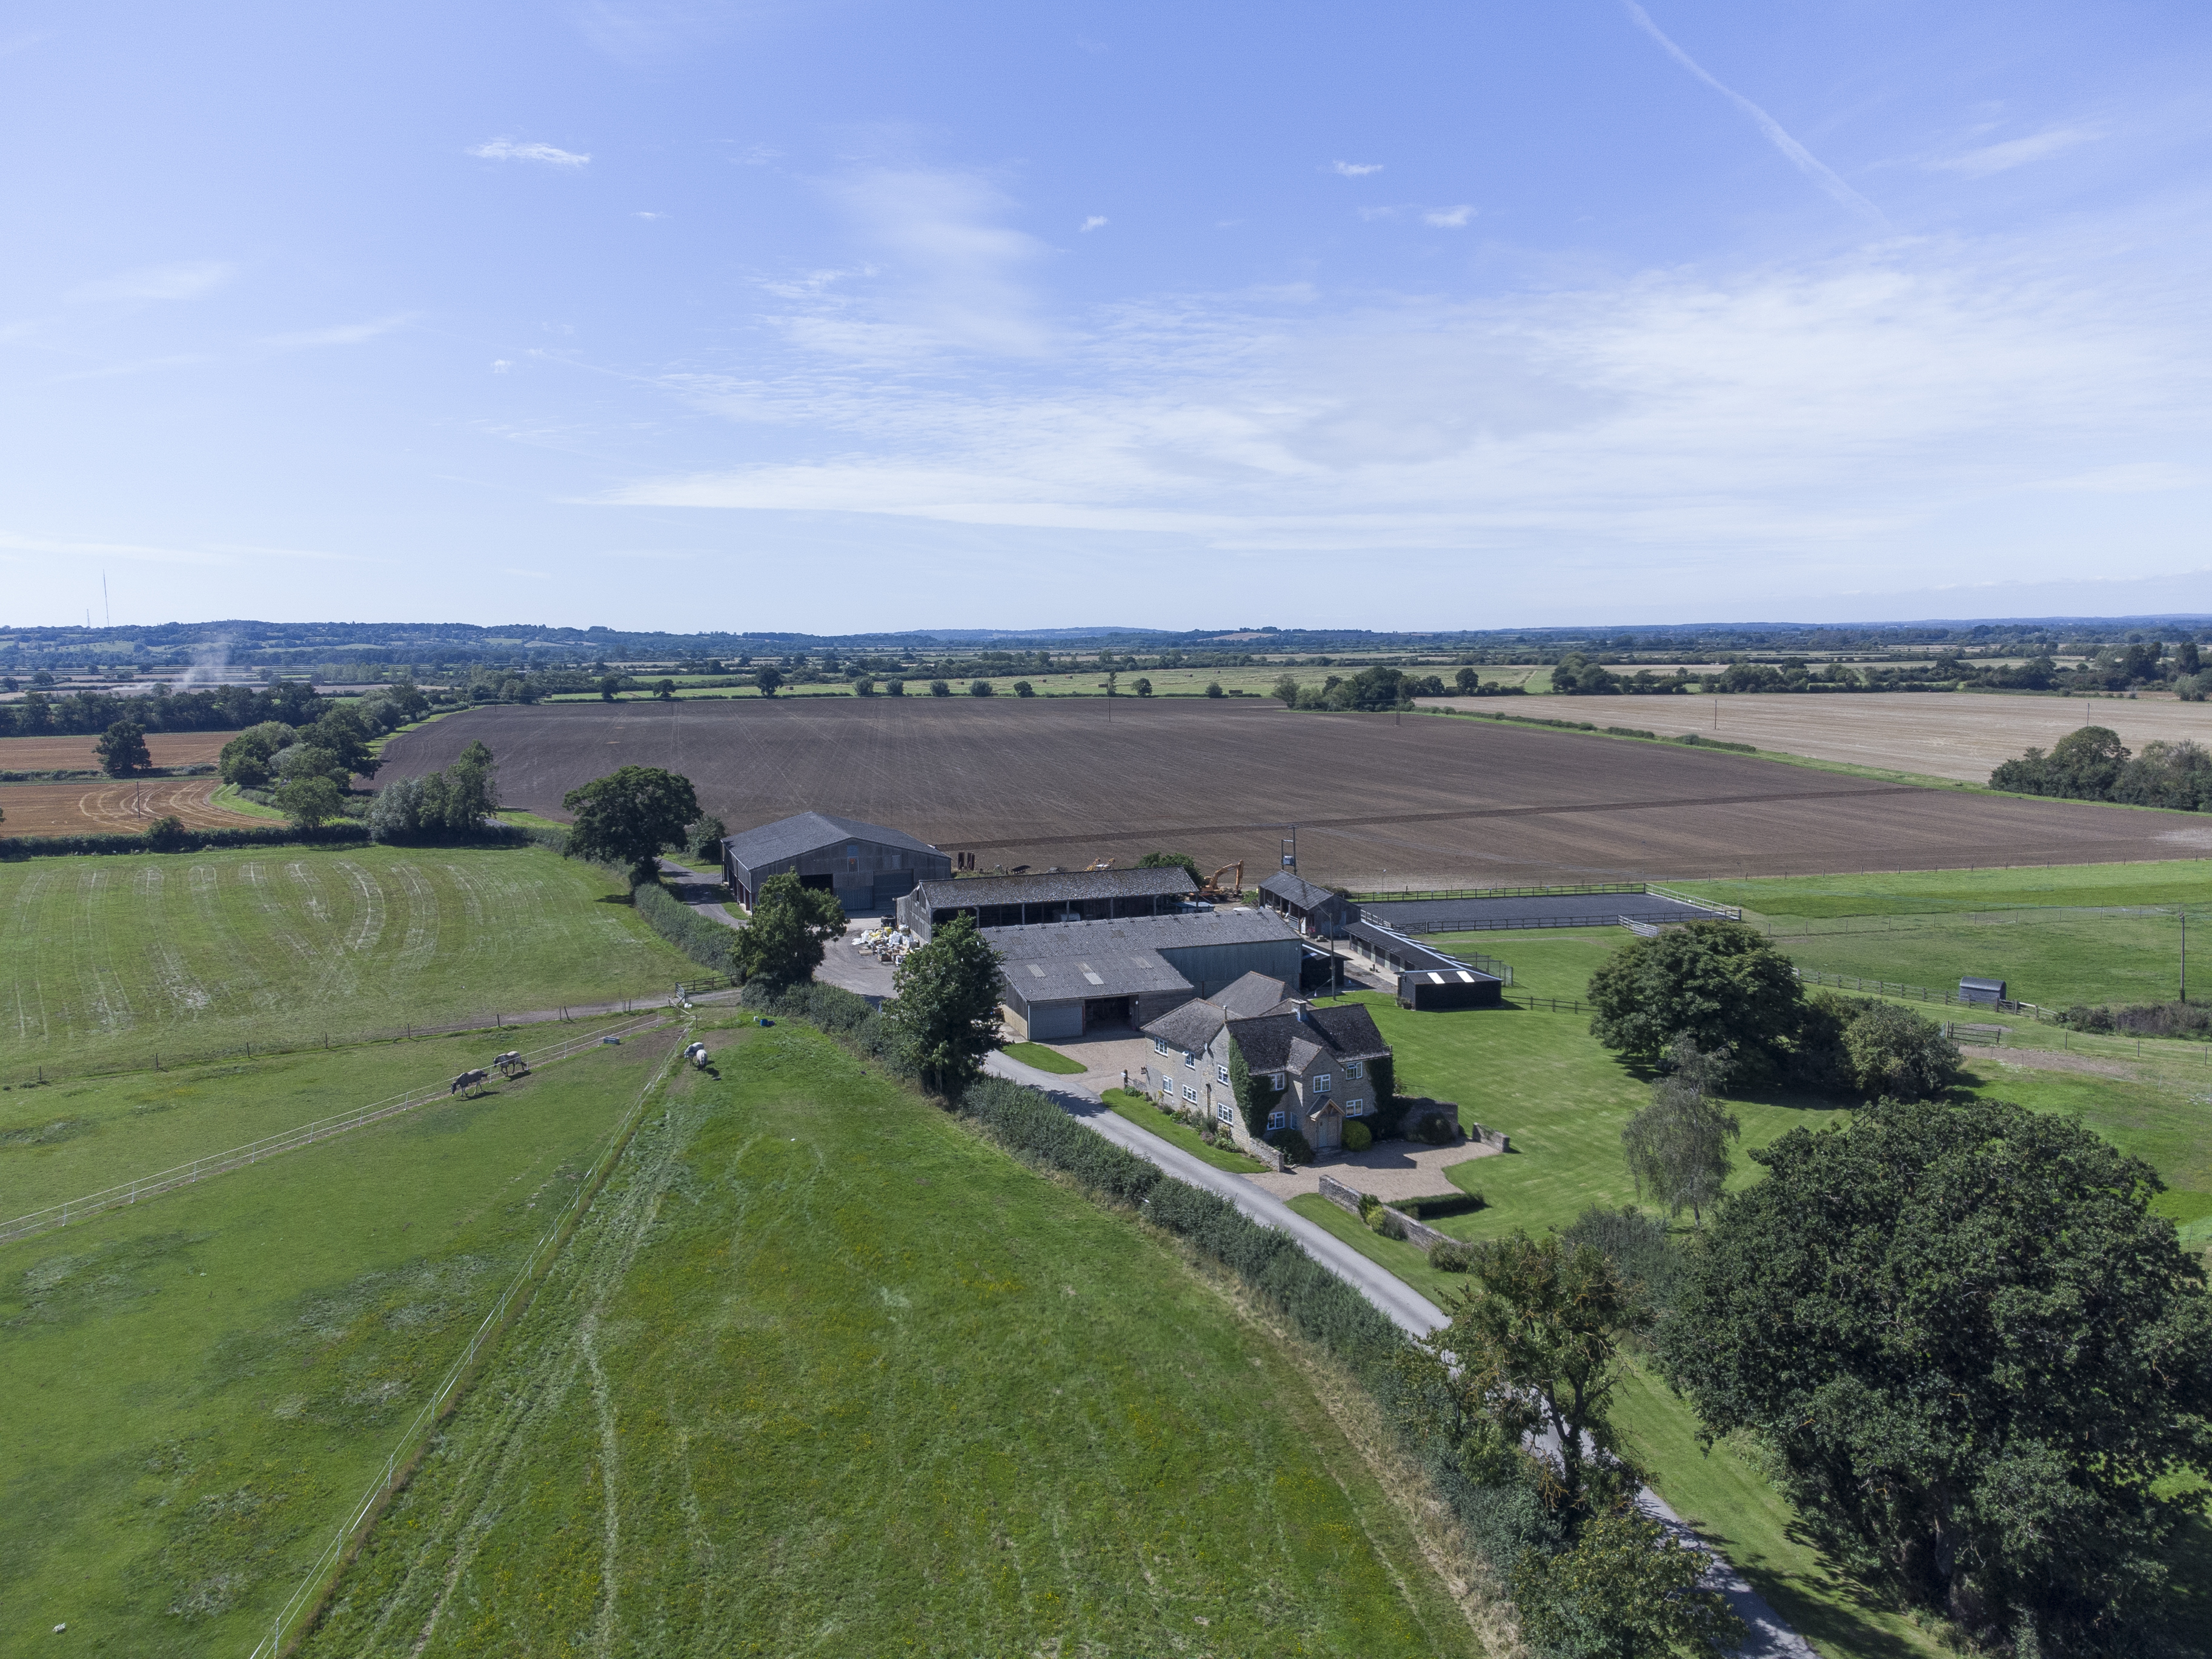
Ruses Farm & Hempstead Hall Farm, Hempstead CB10 / 392.4 acres / For sale


EMAIL Sam
01423 707801
Associate Partner
Sam Johnson
EMAIL Jamie
01223 346592
Senior Surveyor
Jamie Elbourn

EMAIL Jamie
01223 346592
Senior Surveyor
Jamie Elbourn

Overview and spotlight on the East
Manor Farm, Whitecross Green, Oxfordshire / 388 acres / Sold
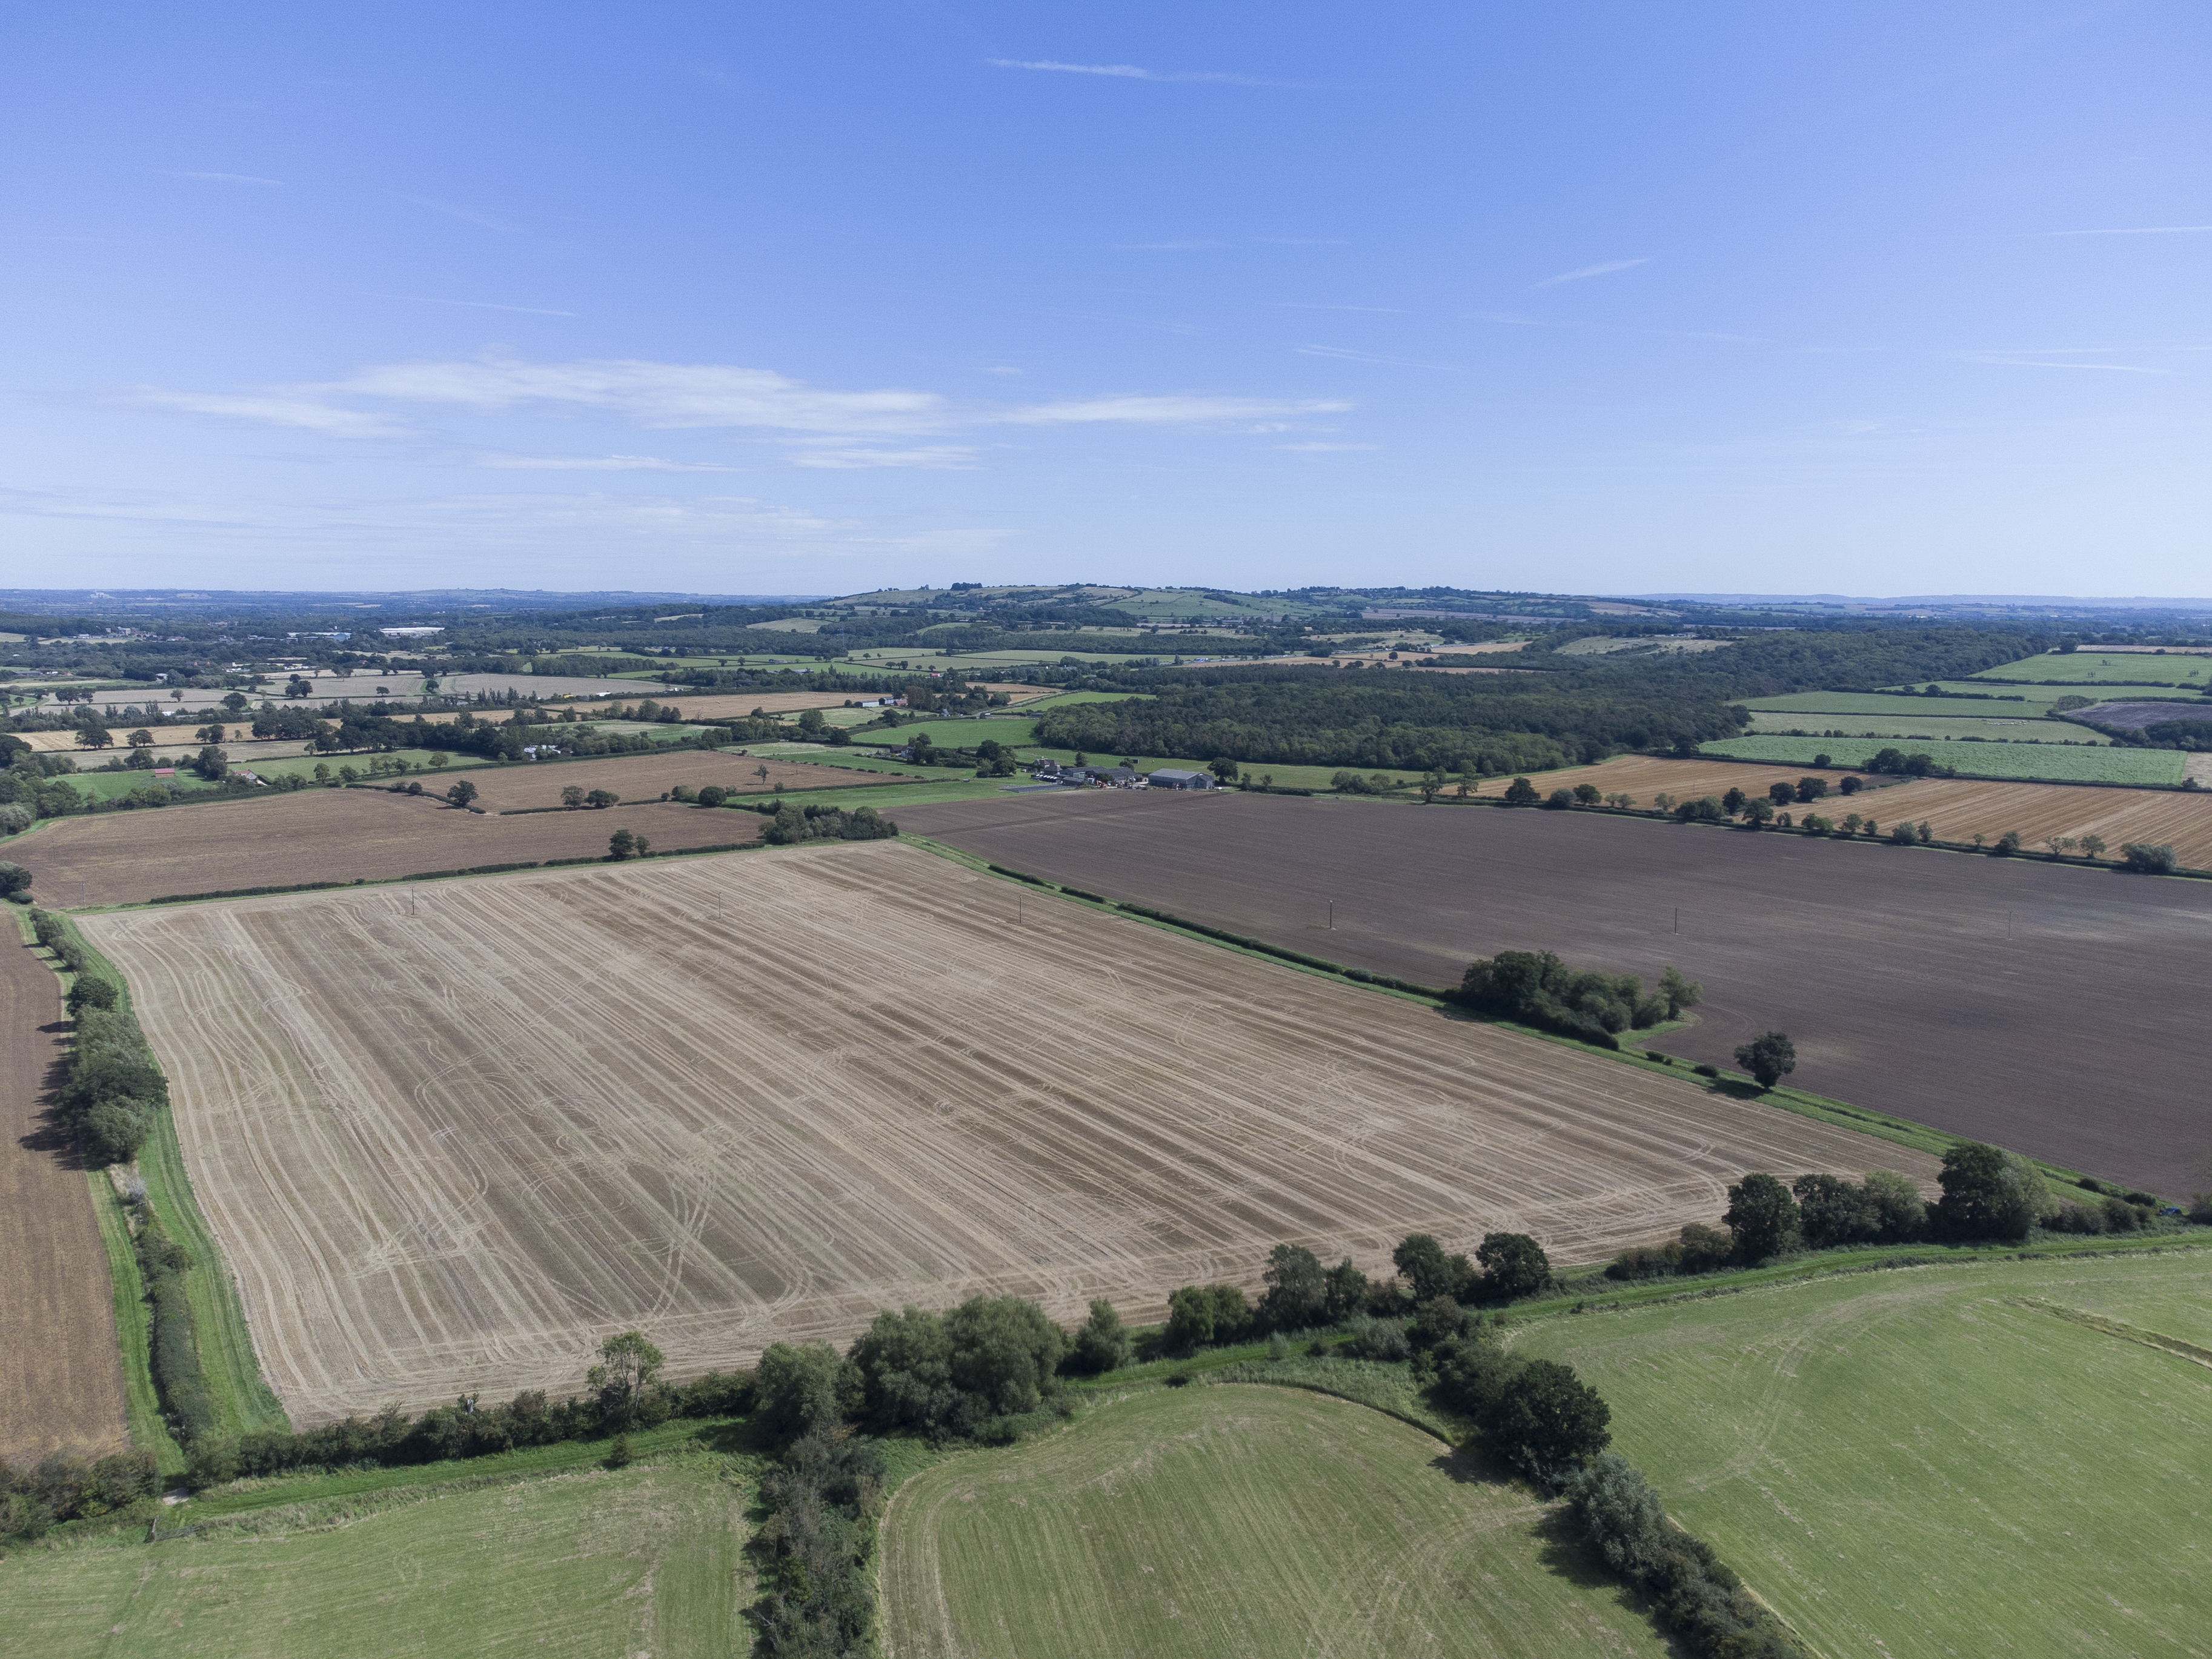
Manor Farm, Whitecross Green, Oxfordshire / 388 acres / Sold
Source: Carter Jonas
Source: Carter Jonas
Source: Farmers Weekly
Source: Farmers Weekly
Download the full report
+1.8%
from
Q4 2023
0.0%
from
Q3 2024
per acre
£7,889
+1.4%
from
Q4 2023
0.0%
from
Q3 2024
Average pasture land value in Q4
per acre
£9,722
Average arable land value in Q4
Land values:
the national view
Although the rate of annual growth in arable and pasture land values has moderated from its recent highs, land values have been on an upward trend for nearly four years. This demonstrates the resilience of the market and sustained investor confidence in farmland assets.
There is an increasing divergence in the growth in prime and secondary or tertiary land values. Prime values have seen the strongest growth, whilst lower quality land or that in less sought-after locations, have experienced a more modest growth rate. We expect this polarisation to continue into 2025.
The Autumn Budget was of disappointment to the industry. However, we expect land values to remain stable in 2025 and do not anticipate a significant market reaction ahead of April 2026 (when the change is effective).


Download the full report
For more commentary, download the full report as a PDF.
Land values:
the regional view
Click a location for
a local overview
WEST MIDLANDS
NORTH EAST
SOUTH WEST
WALES
NORTH WEST
YORKSHIRE & HUMBER
EAST MIDLANDS
EAST OF ENGLAND
SOUTH EAST
East of England land values

EMAIL Jamie
01223 346592
Senior Surveyor
Jamie Elbourn
CLOSE

View on desktop for a full overview
EMAIL Sam
01423 707801
Associate Partner
Sam Johnson
North West land values

CLOSE
View on desktop for a full overview
EMAIL Hugh
01248 360417
Partner
Hugh O’Donnell
Wales land values

CLOSE
View on desktop for a full overview
CLOSE
View on desktop for a full overview
EMAIL David
01823 428591
Partner
David Hebditch
South West land values

EMAIL Sam
01423 707801
Associate Partner
Sam Johnson
North East land values

CLOSE
View on desktop for a full overview
EMAIL Sam
01423 707801
Associate Partner
Sam Johnson
Yorkshire and the
Humber land values

CLOSE
View on desktop for a full overview
East Midlands land values

CLOSE
View on desktop for a full overview
EMAIL Jamie
01223 346592
Senior Surveyor
Jamie Elbourn
EMAIL EDWARD
0121 3060386
Associate Partner
Edward Beale
West Midlands land values

CLOSE
View on desktop for a full overview
EMAIL Andrew
07880 084633
Partner
Andrew Chandler
View on desktop for a full overview
South East land values

CLOSE
Download the full report
For more commentary, download the full report as a PDF.
Supply and
demand
FIGURE 4: Cumulative publicly marketed farmland supply

FIGURE 3: Year-to-date publicly marketed farmland supply

Source: Farmers Weekly
Source: Farmers Weekly
New supply slowed in the second half of the year after an influx in the first half, ending the year broadly level with 2023. A promising pipeline of launches set for the spring is expected to be met by a healthy level of demand.
The industry is grappling with new challenges, including a new tax regime, increases to National Insurance contributions, higher minimum wages and sharper-than-expected cuts to direct payments. This is alongside ongoing challenges, notably labour shortages and fluctuating commodity prices.
Download the full report
For more commentary, download the full report as a PDF.
Source: Carter Jonas, AHDB, Farmers Weekly, Defra, ONS, OPEC
Commodity price trends
Click a trend for more info
FIGURE 5
Commodity prices
Inputs
Outputs
Crude Oil
Fertiliser
Red Diesel
Milk
Beef
Feed Wheat
Oilseed Rape
Pork
Sheep
Chicken
CRUDE OIL
Unit
Latest data
Date
Quarterly change
Annual change
£/barrel
57.8
Dec' 24
3.8%
-7.4%

Fertiliser
Unit
Latest data
Date
Quarterly change
Annual change
£/tonne
333.6
Dec' 24
0.9%
-5.7%
Red Diesel
Unit
Latest data
Date
Quarterly change
Annual change
pence/litres
76.1
Dec' 24
1.2%
-9.2%
Feed Wheat
Unit
Latest data
Date
Quarterly change
Annual change
£/tonne
191.1
Dec' 24
-0.3%
-2.1%
oilseed rape
Unit
Latest data
Date
Quarterly change
Annual change
£/tonne
428.2
Dec' 24
7.5%
13.9%
MILK
Unit
Latest data
Date
Quarterly change
Annual change
pence/litre
45.2
Oct' 24
12.7%
21.8%
BEEF
Unit
Latest data
Date
Quarterly change
Annual change
pence/kg dw
547.7
Dec' 24
8.3%
12.6%
Pork
Unit
Latest data
Date
Quarterly change
Annual change
pence/kg dw
204.7
Dec' 24
-1.8%
-2.8%
SHEEP
Unit
Latest data
Date
Quarterly change
Annual change
pence/kg dw
690.3
Dec' 24
7.1%
17.6%
CHICKEN
Unit
Latest data
Date
Quarterly change
Annual change
pence/kg dw
380.0
Nov' 24
-1.0%
-2.3%
Download the full report
For more commentary, download the full report as a PDF.
EMAIL Andrew
07880 084633
Head of Rural Agency
Andrew Chandler
Get in touch
EMAIL SOPHIE
020 7493 0685
Research Associate
Sophie Davidson