Local market report and housing update
Winter 2022/23
Snapshot & Location
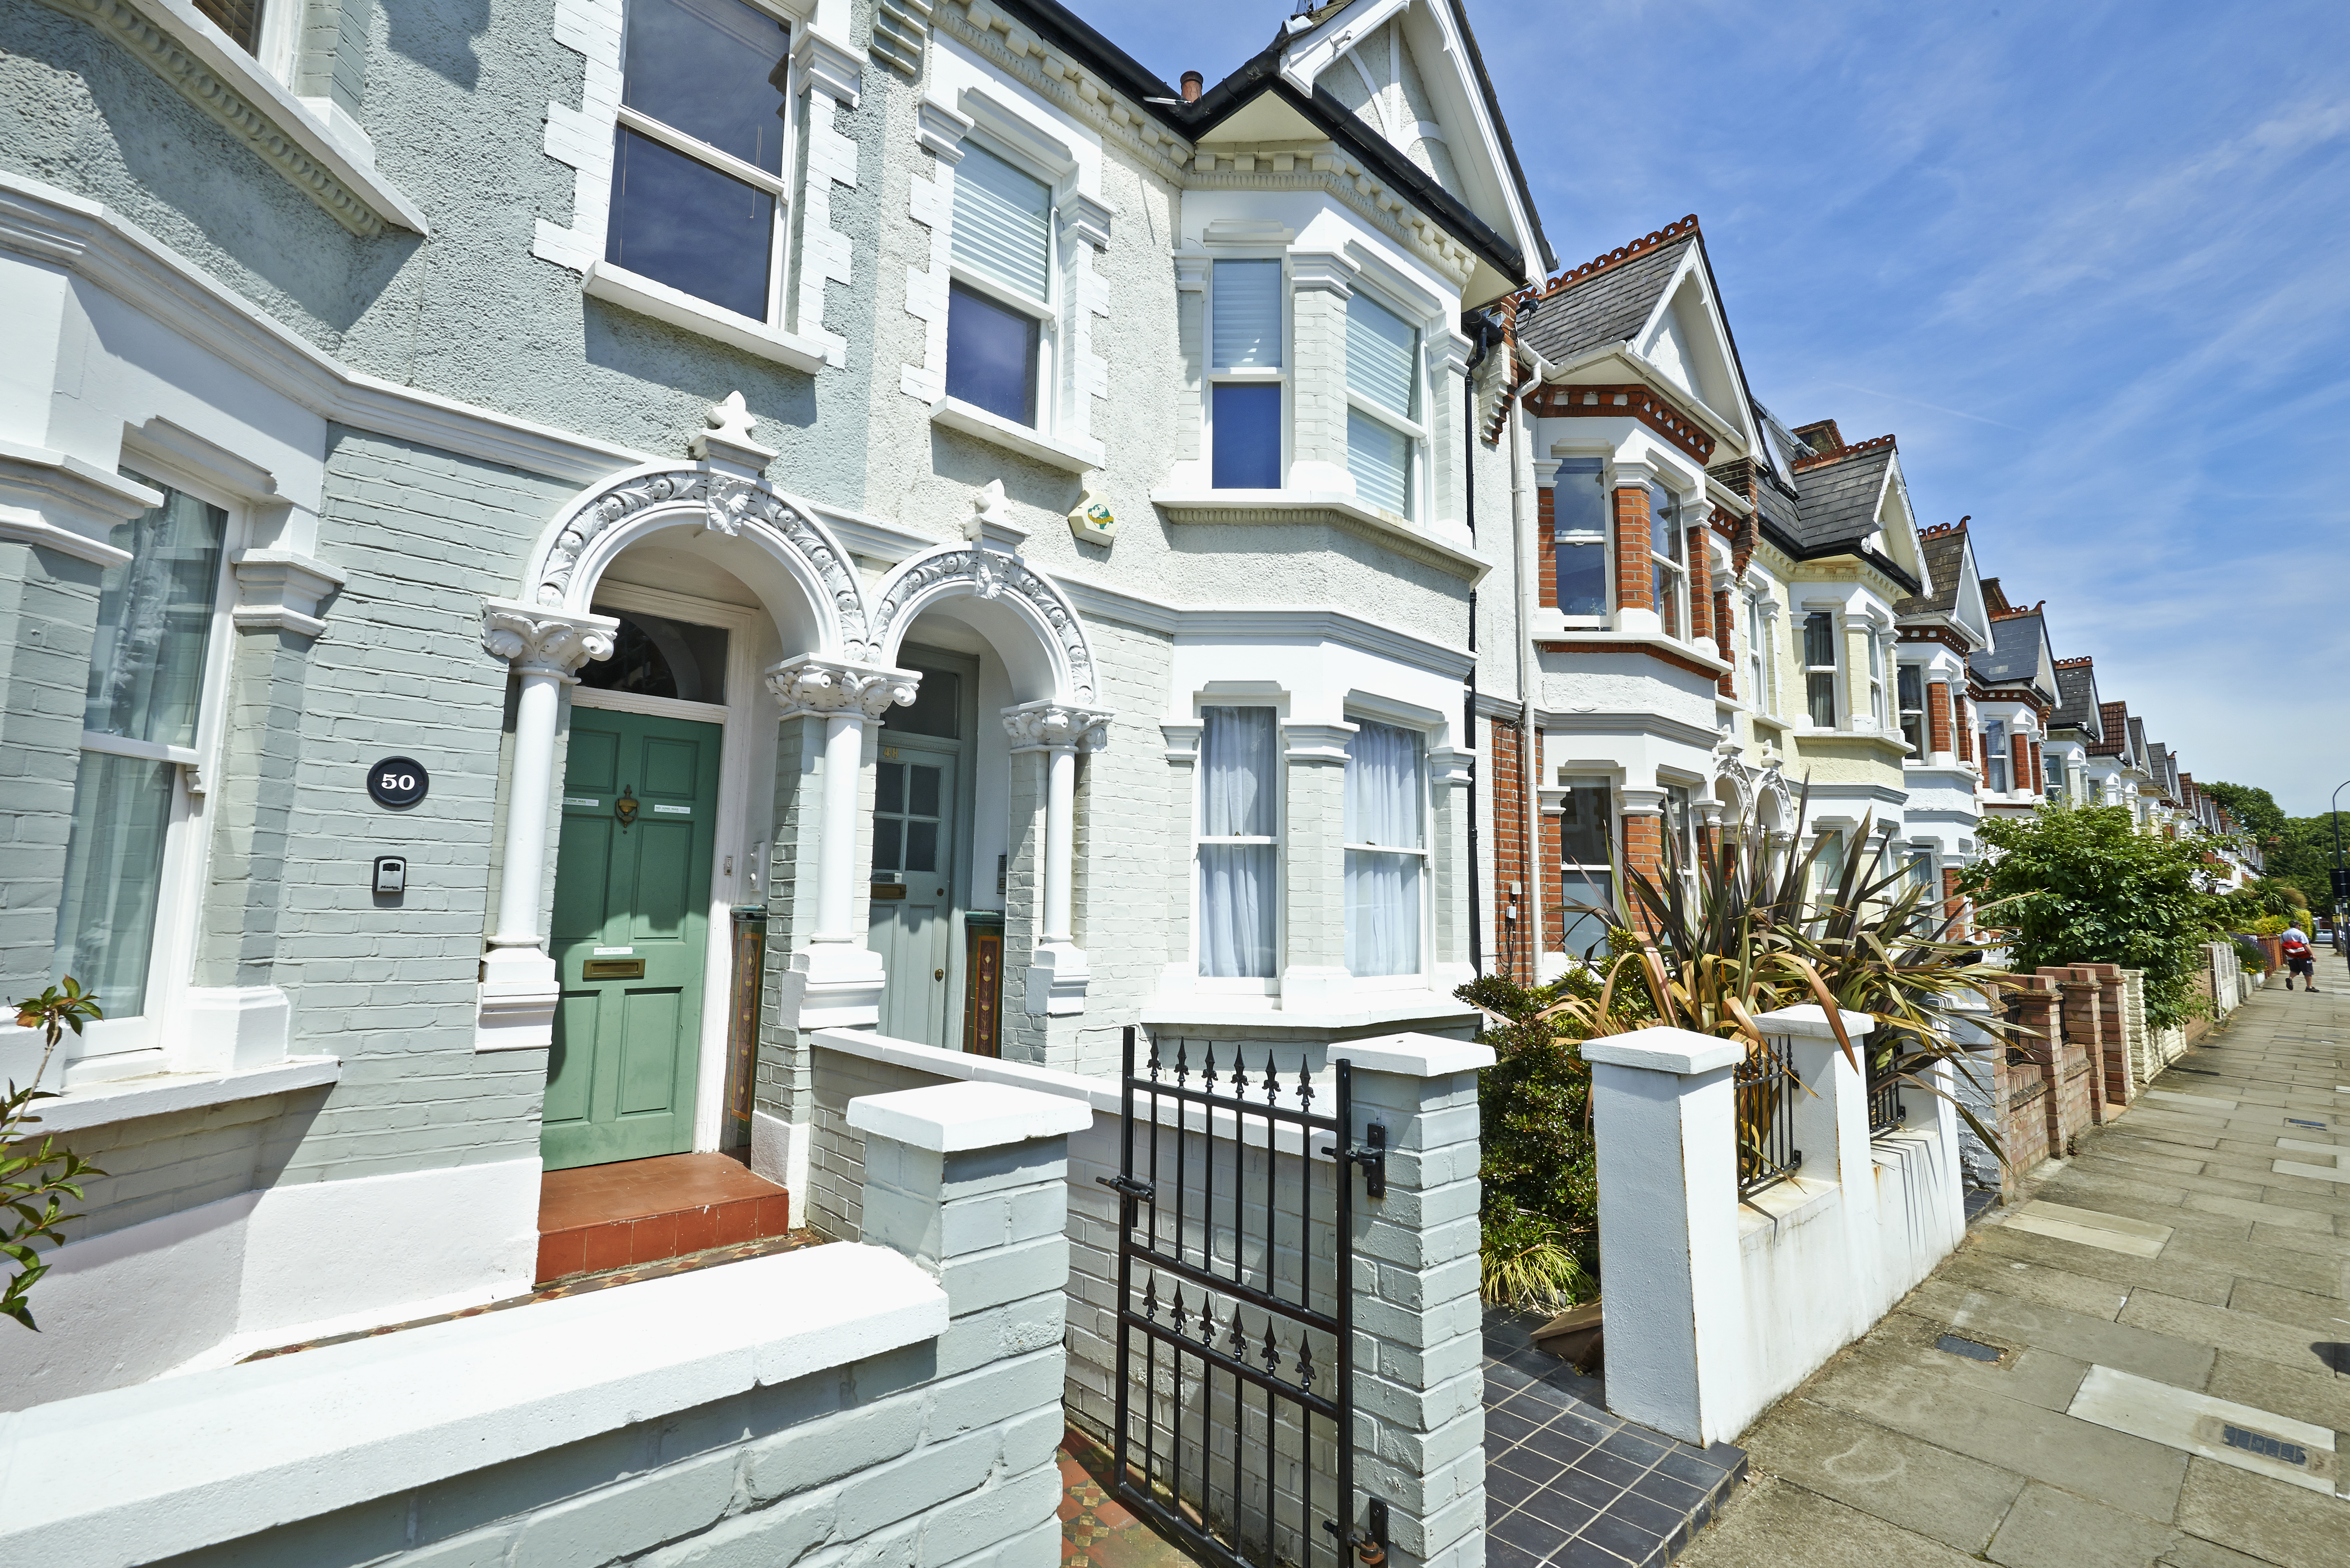
Located in the London Borough of Hammersmith and Fulham, Fulham in West London lies on the north bank of the River Thames. The area has a long history of both industry and enterprise as well as being a leafy, green, suburban area of central London. Despite losing some of its cultural heritage to industrialisation and war-time bombing, the area is still very much sought after for some of its grand 18th and 19th Century residences and also its low-rise, industrial style urban homes.
Location Map
Local demographics & economic trends
The population of Hammersmith and Fulham is currently estimated to be 192,060, increasing 5.2% over the last decade, equating to an additional 9,560 people over ten years. Looking ahead, the population is expected to continue to grow, rising by around 4% to 200,920 by 2032, or an additional 8,230 people.
Employment rates in Hammersmith and Fulham are high at 74.6%, with an unemployment rate currently estimated to be 4.7%. These figures are both slightly different to the national average of 75.5% and 3.8%, respectively but they are in line with wider London figures.
Connectivity
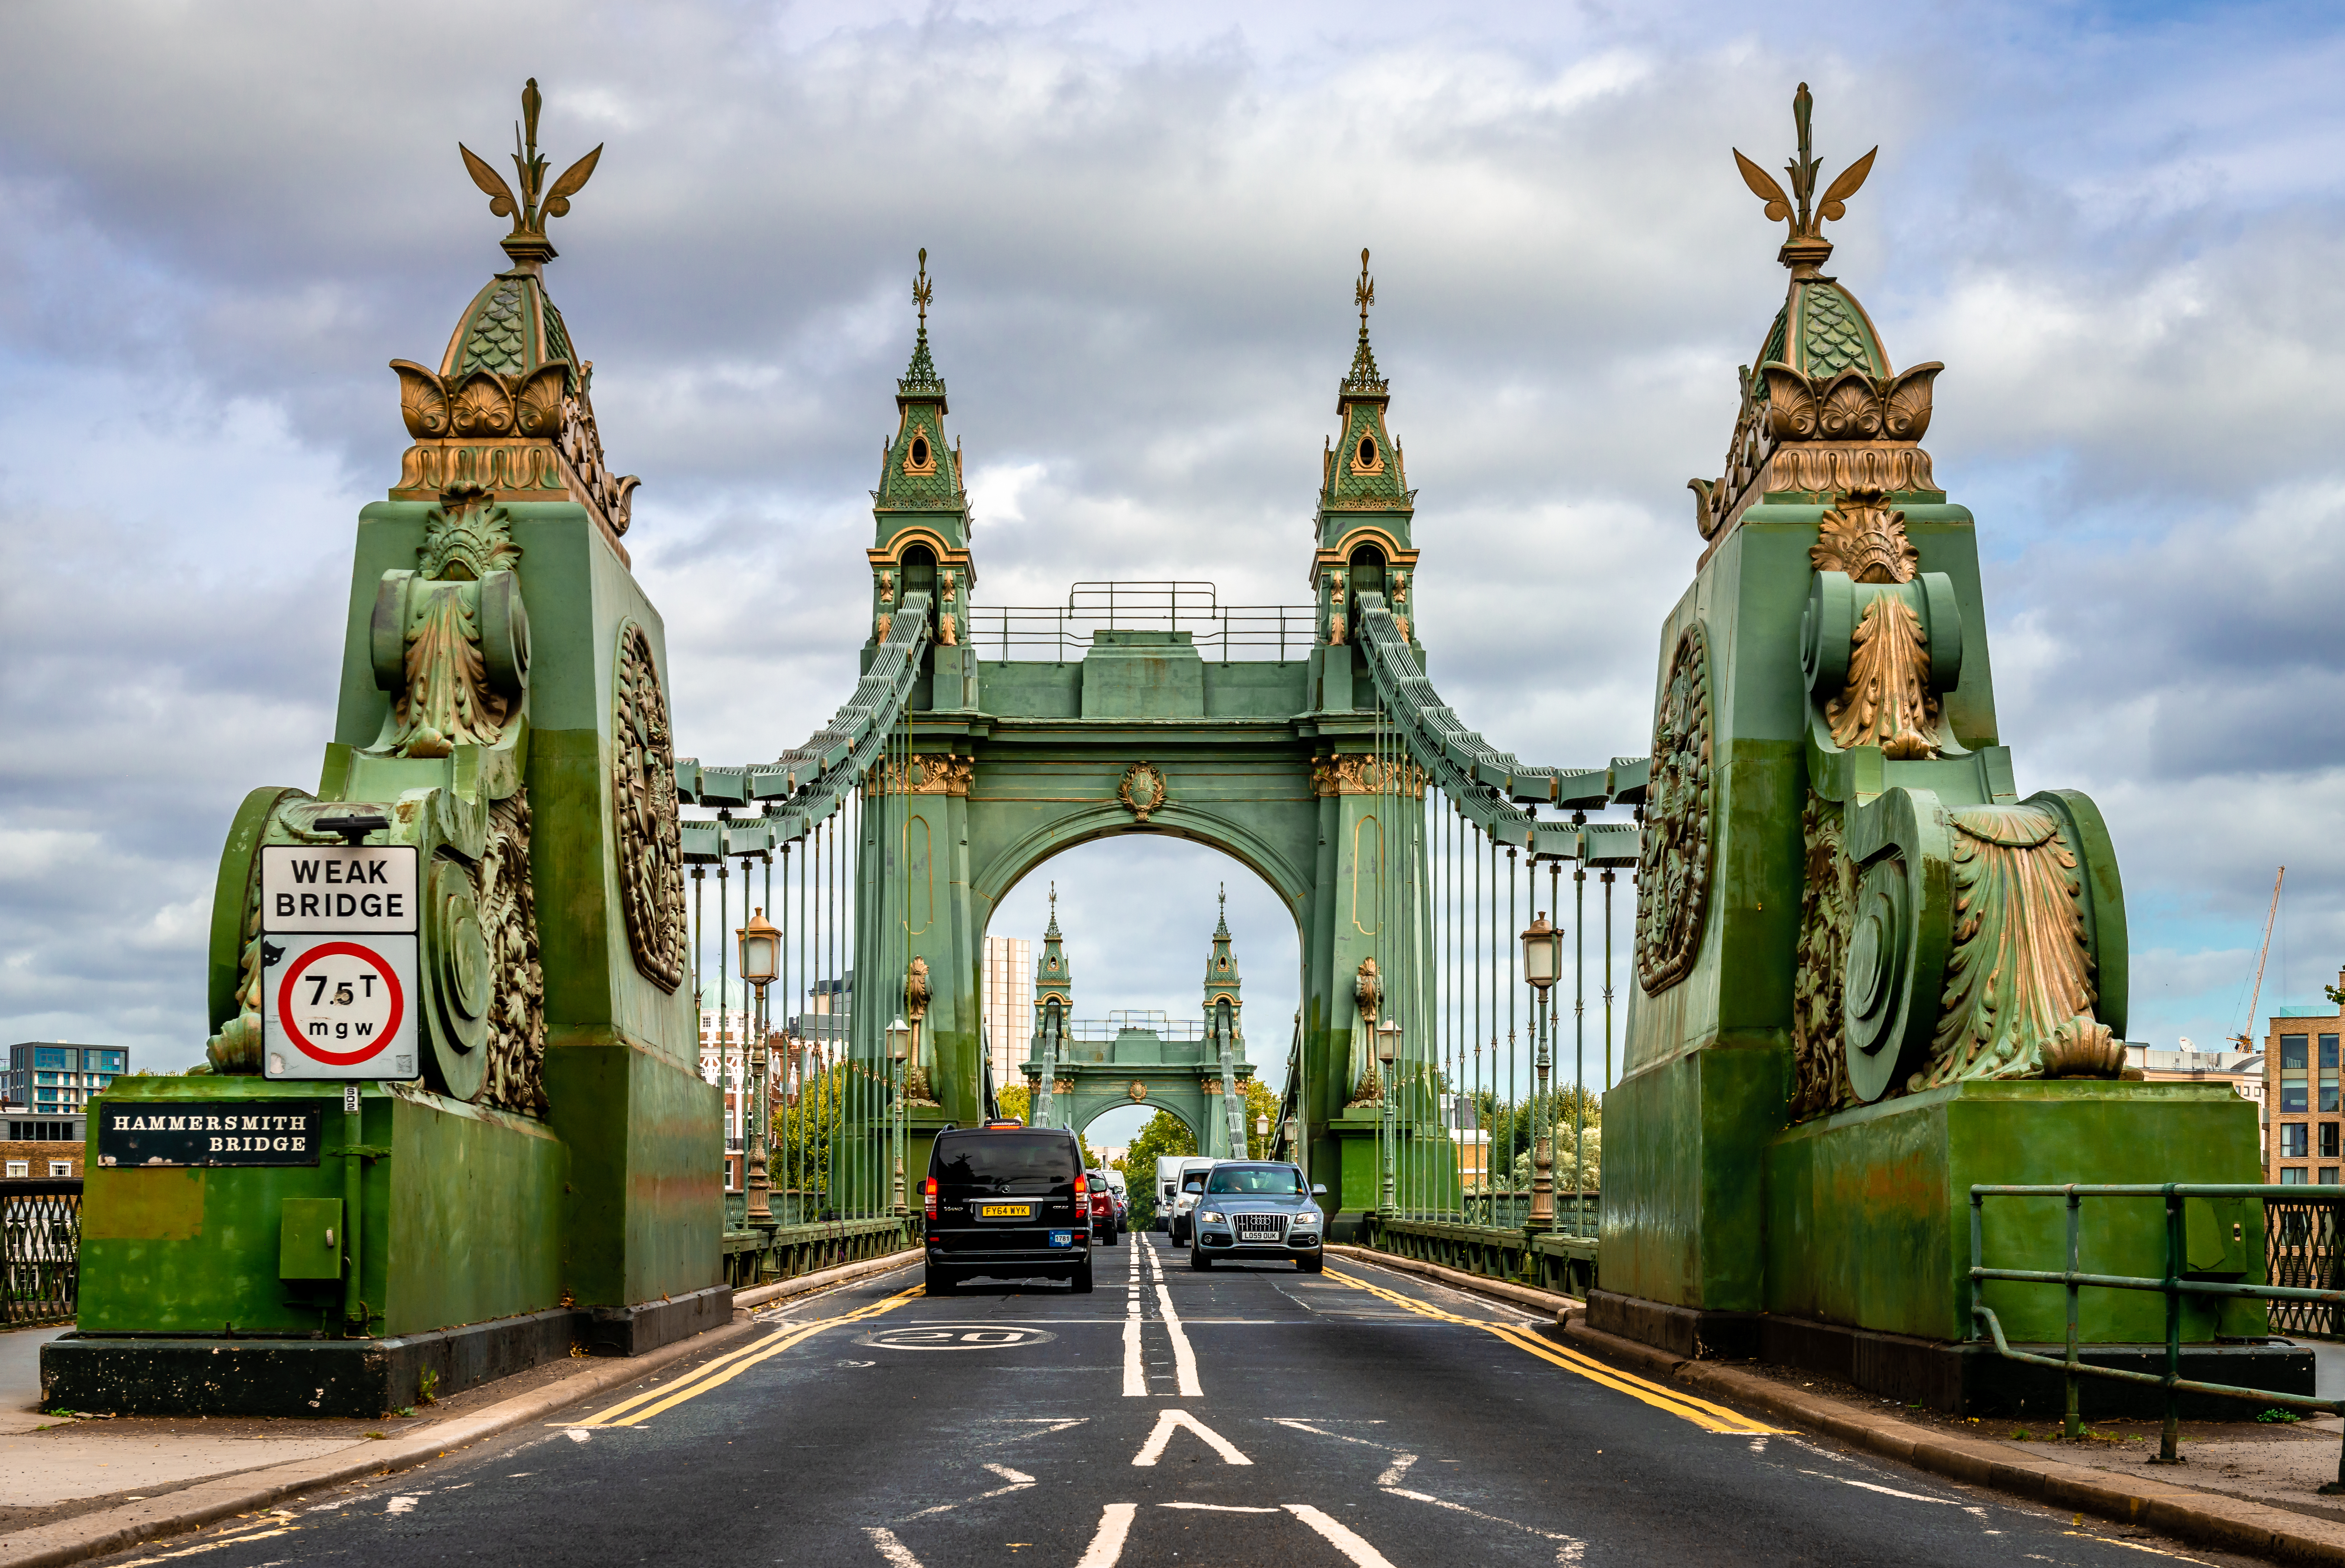
Fulham is conveniently located inside a ‘dip’ of the Thames River which means it is surrounded on three sides by the River. There are two major road crossings over the river with Putney Bridge crossing towards the south west, Putney and on to Richmond while Battersea Bridge crosses towards the south and Wandsworth. The major trunk road of the A4 crosses to the north of Fulham, linking the west of London and beyond to central London, Kensington and Chelsea, etc. The area is home to no fewer than five London Underground stations of the District Line (Putney Bridge, Parsons Green, Fulham Broadway, West Kensington and Baron’s Court) with one also serving the Piccadilly Line (Baron’s Court).


The local Housing Market
Sales Market
Average house prices by property type and location
Fulham
Hammersmith and Fulham
Greater London
Detached
Semi-detached
Terraced
Flat
Overall Average
£3,771,875
£2,732,178
£1,468,347
£667,977
£919,373
£1,408,887
£1,317,786
£1,113,860
£642,762
£758,330
£1,108,042
£704,647
£595,324
£447,689
£541,720
Source: Fulham data: REalyse, latest 12 month average; Hammersmith and Fulham and London data: HM Land Registry

"The average house price in Fulham is currently £919,373, which is nearly 70% higher than the average London price"
Chart
Chart
Rental Market
According to the latest data from the Office for National Statistics (ONS) (Q1 2022), average rents in Hammersmith and Fulham are £2,036 per calendar month (pcm). This is almost 25% above the wider London average of £1,629 pcm and reflects the central and popular location of the area, with reduced travel costs and the premium which people are willing to pay to live centrally in London.
Fulham


The area is well connected to central London via London Underground, while its typical grid pattern of tree-lined, leafy streets and open green spaces makes the area a very attractive place to live in London. It is popular with families, professionals, young people and older generations. The well-established high streets have many popular and well-known retail outlets and boutiques as well as dozens of restaurants, cafes, eateries, pubs and bars.


Of those employed in the area, a high number of them are employed in Managerial, Professional and Associate Professional occupations, making up over 63% of all occupational groups. In terms of industry, there is a wide range of sectors in which those employed in Hammersmith and Fulham take part. The largest groups are found in professional, scientific and technical activities (18%), information and communication (10%) and health and social work (9.8%). Unsurprisingly, Fulham is a strong commuter area so many of these jobs will be located outside of the immediate area, for which employees travel to. Nevertheless, Chelsea and Westminster hospital located in Chelsea, bordering Fulham, employs a large number of people who will also live in the area. Median earnings in Hammersmith and Fulham are currently estimated at £39,430, around 3% above the national average.


Fulham is home to several primary and secondary schools including independent pre-preparatory and preparatory schools. In all there are 23 state primary and secondary schools, of which six are Ofsted rated ‘Outstanding’. There are a further seven independent and preparatory schools, several of which are noted establishments including Fulham Cross Girls School, The London Oratory School, Lady Margaret and Fulham Cross Academy. The area caters to the large French-speaking population with a French language primary school which is a feeder school for the Lycee Francais Charles de Gaulle in South Kensington.
Average house prices across many of the inner London boroughs over the last two years have not seen the same kind of robust price growth as many other parts of outer London and certainly the rest of the UK. This trend has been seen across many of the more traditionally expensive and less affordable areas of not just London but the country as a whole. The average house price in Fulham is currently £919,373, which is nearly 70% higher than the average London price and reflects an annual growth rate of 2.3%. This compares with an annual house price fall of just under 5% across the whole borough of Hammersmith and Fulham, while Greater London’s house inflation was 6.7% over the year.
The Local Housing Market
Average house price
Average house price growth
Average rent
(£ per calendar month)
Annual rental growth
Gross Yield
£919,373
2.3%
30%
£2,697
3.8%
Sources: HM Land Registry, REalyse
The timelier data from REalyse and Rightmove shows that current (October 2022, 12 month rolling average) asking rents in Fulham are now approaching £2,700 pcm which suggests an increase of 30% over just the last 12 months. However, it must be remembered that during the pandemic and various lockdown restrictions a lot of the central London flats market saw a dip in rent rates as people moved away from urban locations. This resulted in rents dropping considerably last year and this has now reversed, resulting in a huge jump in average rents over the 12 month period. When compared with the longer-term five-year growth rate, this shows a more realistic rate of 8% growth over the last five years.
Sources used: Carter Jonas Research, Experian, Google maps, HM Land Registry, Office for National Statistics, REalyse, Rightmove
Notes: REalyse rental data 12-month rolling average
Get in touch

Email me
020 7731 3333
Sales
Wayland Ward-Smith

Email me
020 7751 8898
Lettings
Igor Simonov
For further information, please get in touch with one of our local experts

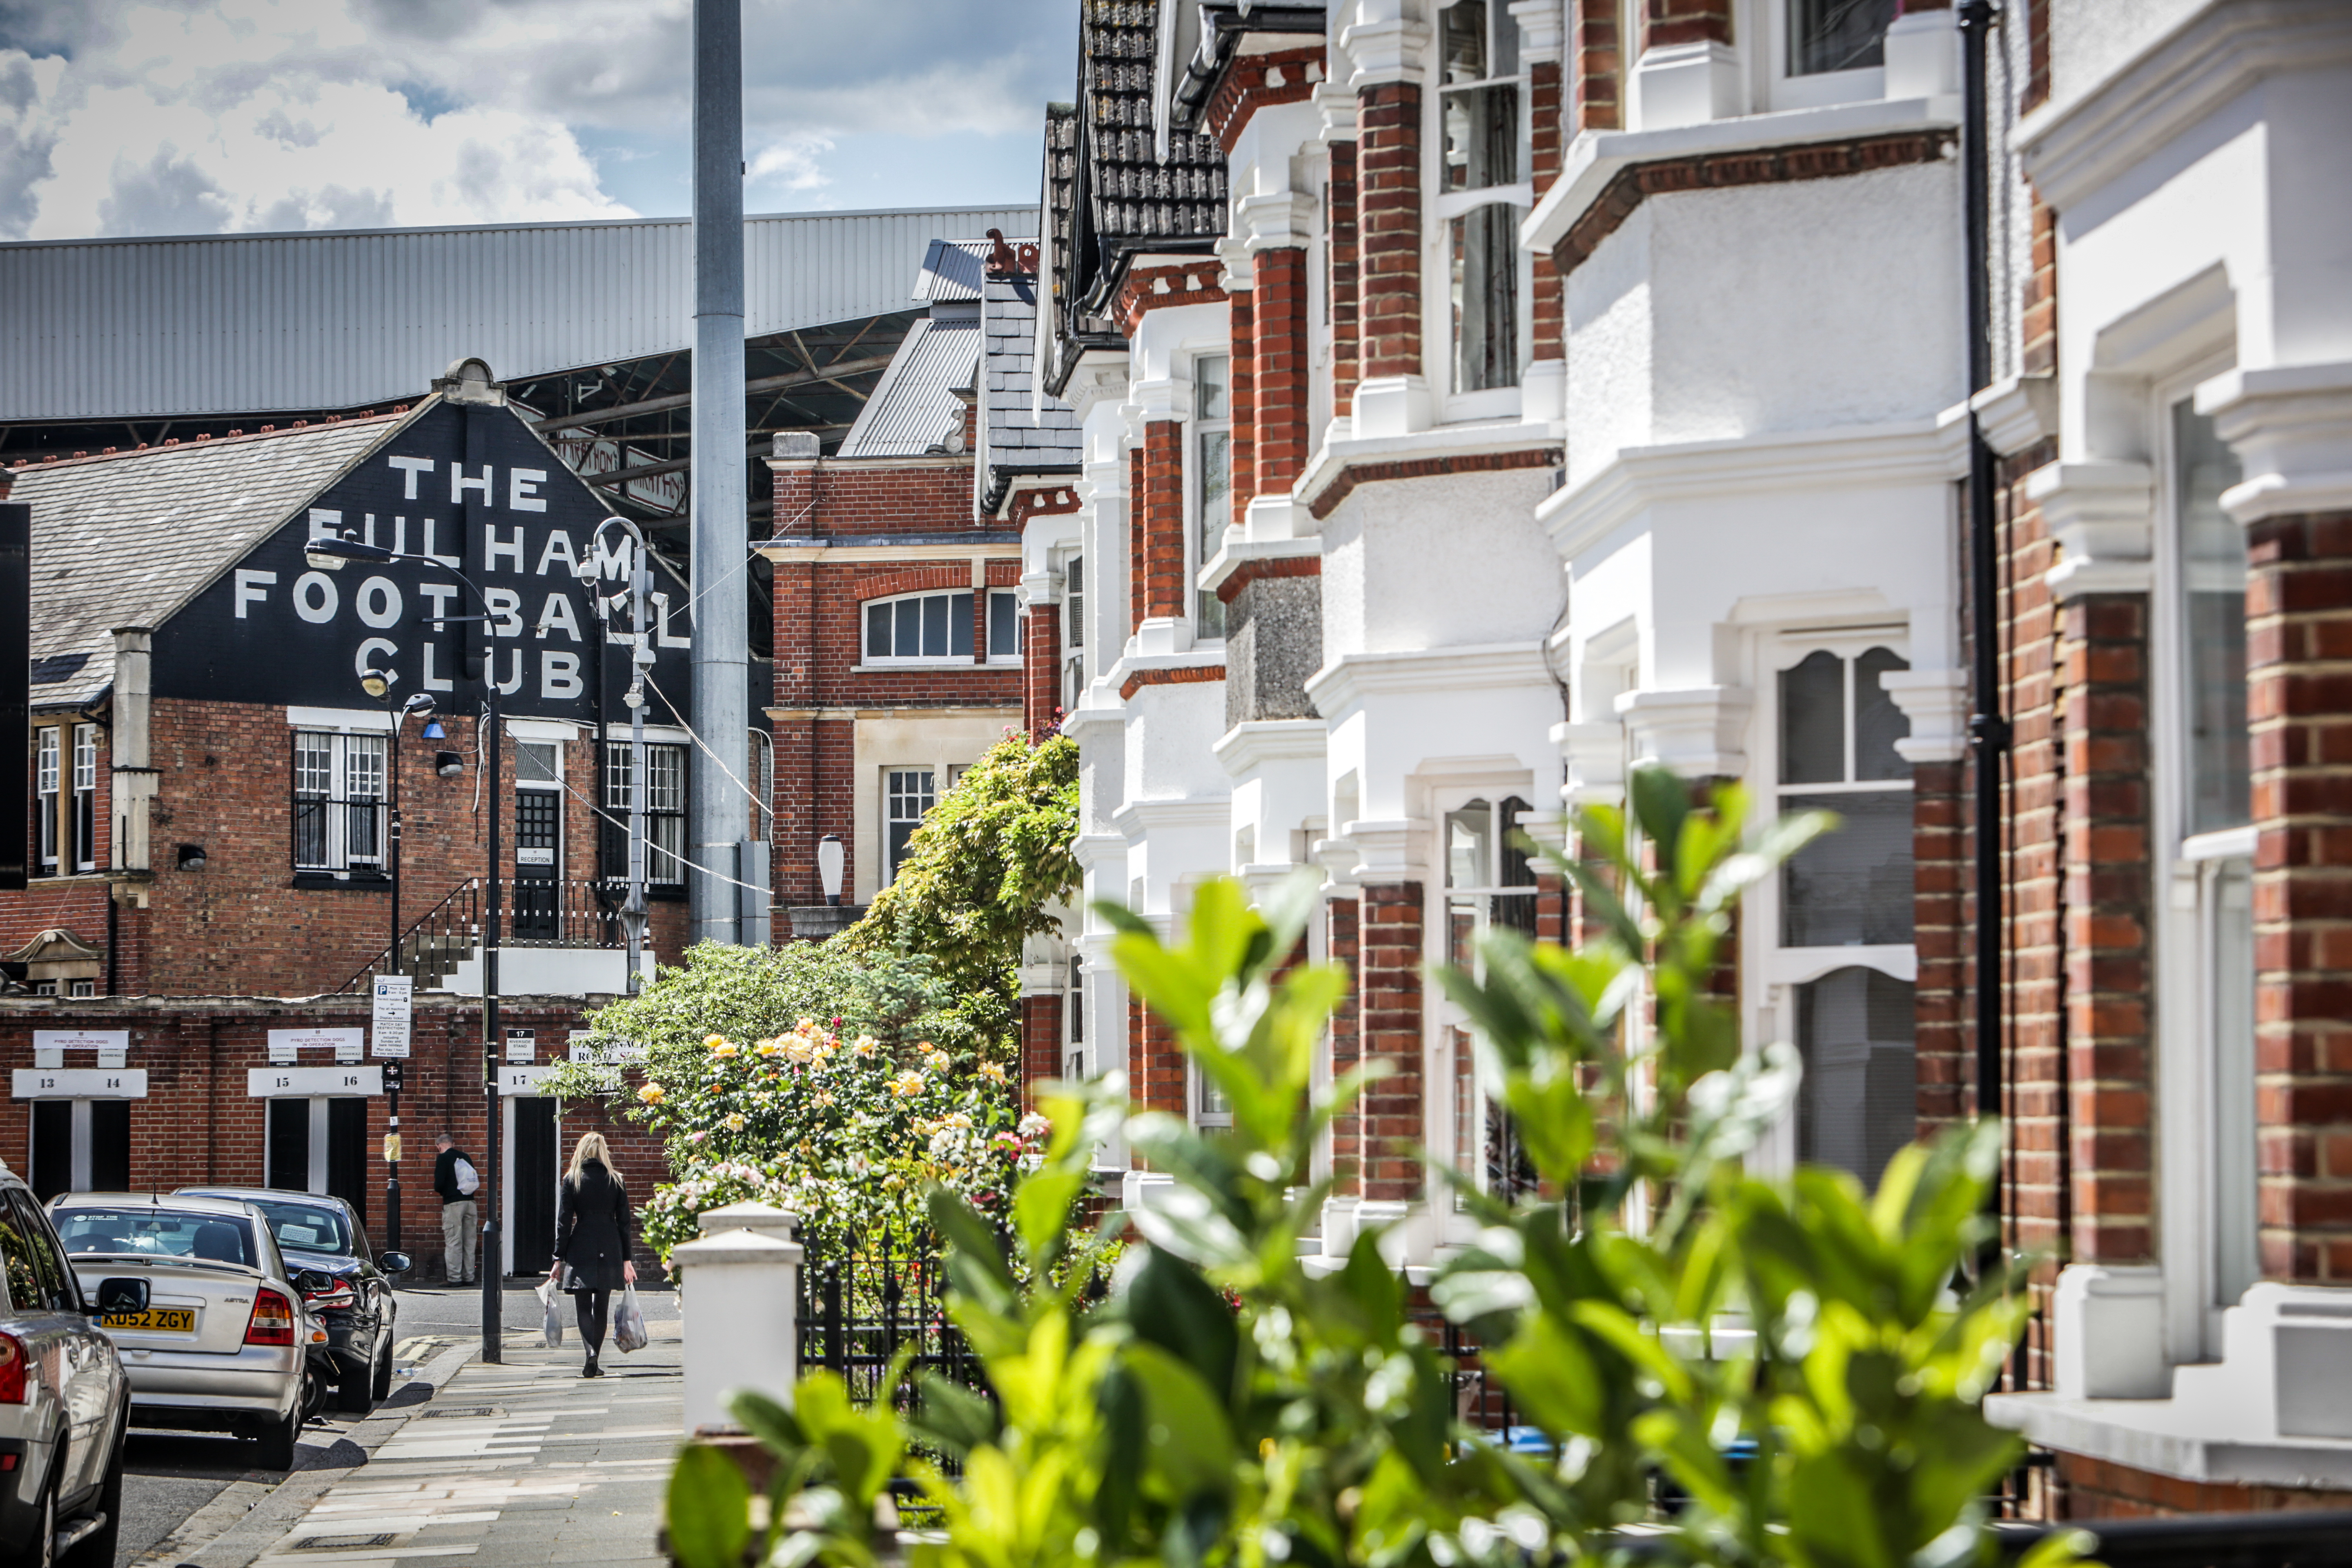
Fulham has a long sporting history and is home to two professional football clubs as well as exclusive, world-renowned polo club (Hurlingham) and tennis club (Queen’s).
Fulham attracts a variety of households, both those looking to base themselves permanently and becoming owner occupiers, but also households at different life stages who may not yet be ready or in a position to own their own home. Its central location makes it very popular with both students, young people and professional couples and as such there is a high level of private renters. Almost 30% of all households in Hammersmith and Fulham are privately renting, compared with 26% as a London average. Just 41% of all households are owner occupiers, well below the national average of 64%.
Location based on nearby top-performing primary and secondary schools is often a very strong factor in deciding where to move and locate, with proximity to the best schools strongly correlated to local average house prices. Research has shown that homes located near top-performing schools can add anywhere from £30,000 - £60,000 to home values. There are 13 ’Outstanding’ schools in and around Hammersmith and Fulham and a further nine independent preparatory (private) schools.
Buyer demand in Hammersmith and Fulham throughout much of the ‘pandemic period’ and certainly during the stamp duty was strong and sales levels reflected this. In 2021 the total number of sales was 12% above the long-run average, placing upward pressure on prices over that period. Since then, both demand and sales have moderated, certainly during the latter half of 2022 when mortgage rates began to rise and cost of living pressures rose. We expect this trend to continue throughout much of 2023, although by the end of the year when mortgage rates are expected to reach a higher degree of stability, we anticipate that buyer demand will gradually return to their long-term averages. Nevertheless, it is still expected that overall housing prices in Hammersmith and Fulham will decline by around 2.7% next year, with a further decline of around 4.5% in 2024.


Notes: Rental rates areas: five-mile radius from centre. Projected house price
growth, incomes and demographics data, areas: Respective local authority


2032 forecast
population
(number)
200,291
Ten-year forecast population
(% change)
4%
Proportion of population who are owner occupiers
41%
Proportion of
population who are private renters
30%
Average annual
income
(2022, provisional)
£59,481
Five-year projected house price growth (cumulative)
8.7%